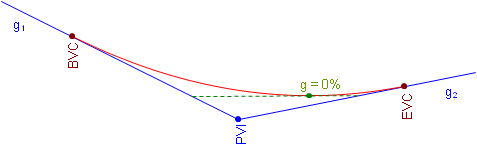
4. High or Low Point
When asked where a curve's highest, or lowest, point is, most people assume it is at the middle of the curve. This is true only under a specific condition. The high or low point occurs where the curve changes direction vertically. This happens where the curve tangent has a 0% grade, Figure B-11.
|
a. Crest Curve |
|
b. Sag Curve |
| Figure B-11 High and Low Point Conditions |
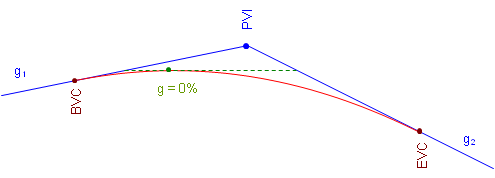
On a crest curve, the tangent grade begins at g1 and deceases uniformly (by k). As long as the grade is positive, the curve elevation keeps increasing. At 0%, the curve reaches its maximum elevation and after that the grade decreases, causing curve elevations to drop.
The opposite is true for a sag curve. As the grade decreases, while it is still negative curve elevations decrease. When the grade is 0%, the elevation decrease stops and as the tangent slope increases so do curve elevations.
The only condition under which the high or low point occurs at the center of the curve is when incoming and outgoing grades are numerically equal but have opposite mathematical signs (eg, +2% into -2%, -3% into +3%).
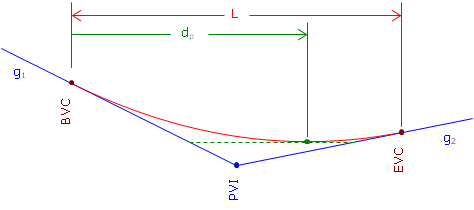
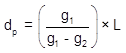
The distance from the BVC to the high/low point, dp in Figure B-12, is determined from Equation B-10:
 |
|
|||
| Figure B-12 Distance to High/Low Point |
The high/low point elevation can be computed by substituting dp in Equation B-7.
In order for Equation B-8 to return a value that makes sense, the grades must have opposite mathematical signs. Consider a +3.00% grade connected to a +1.00% grade with a 500.00 ft long curve. Using Equation B-10 the distance from the BVC to the high/low point is:

The distance exceeds the curve length. What's up with that? Let's sketch it, Figure B-13.
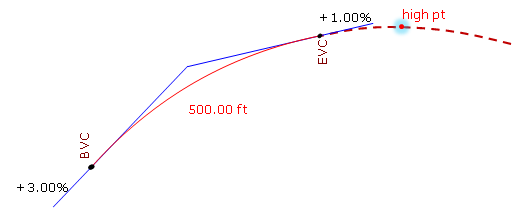 |
| Figure B-13 High Point After the EVC |
Remember, we are using only part of the parabolic curve. 7.5000 stations is the distance to the curve's highest point, it's just on that part of the curve we're not using. Our curve's actual highest point is at the EVC.
Similarly for a +0.50% grade connected to a +2.00% with a 400.00 ft curve:

This means the high/low point occurs before the BVC, Figure B-14.
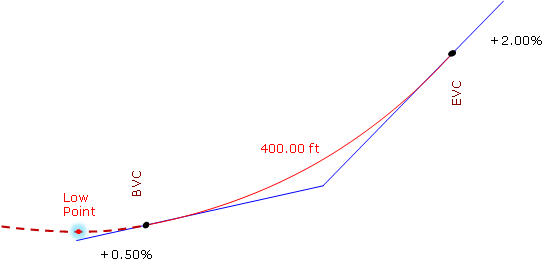 |
| Figure B-14 Low Point Before the BVC |
The lowest point for this curve is at the BVC.