6. Example Contour Creation
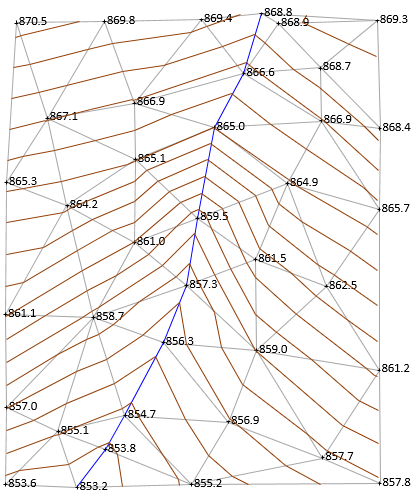
The topographic data in Figure E-19 will be used to create one foot contours.
 |
| Figure E-19 Topographic Data |
An initial TIN is created, Figure E-20.
 |
| Figure E-20 Initial TIN |
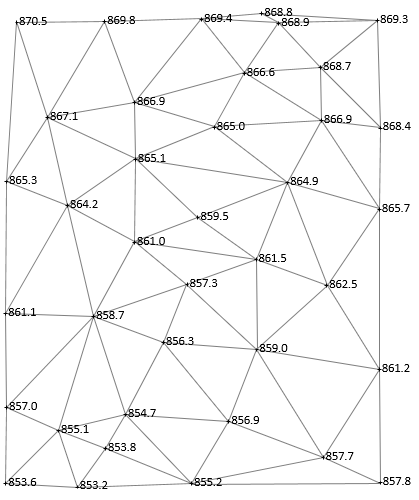
A stream runs north to south through the area. In a few places, the TIN crosses the stream, highlighted in Figure E-21.
 |
| Figure E-21 TIN-Stream Issues |
If the stream isn't accounted for, we could wind up with a model where water runs uphill and down.
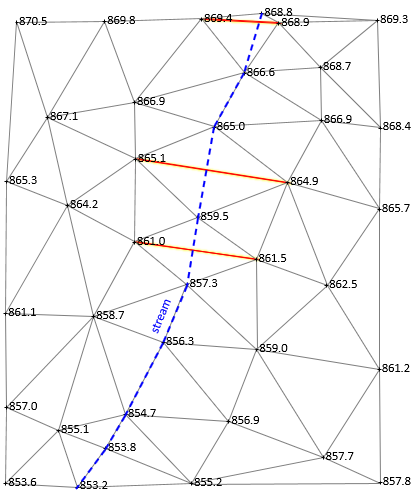
Using the stream as a breakline, the TIN is reconfigured to go along it, Figure E-22.
 |
| Figure E-22 Final TIN with Breakline |
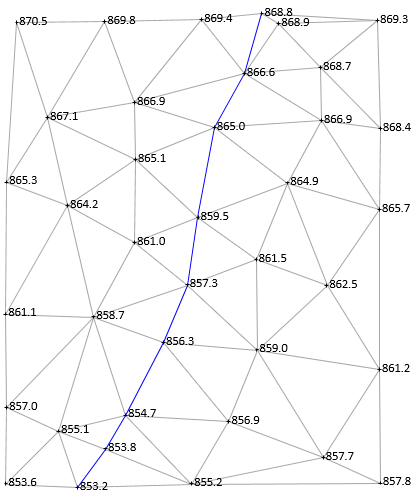
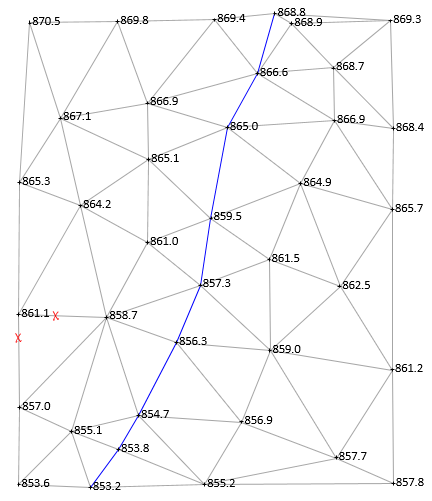
Once the breakline is incorporated into the TIN, interpolations can begin. In this example, we will start by putting in the 861 ft contour line.
861 ft enters the area on the west side between 861.1 and 857.0, shown with a red X in figure E-23.
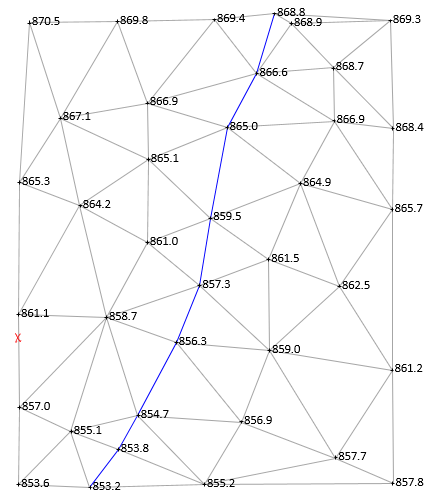 |
| Figure E-33 Starting 861 ft Contour Line |
A contour line enters a triangle on one side and must exit on a second. The line cannot cross the same side of a triangle more than once and it cannot cross all three sides. 861 must exit between 861.1 and 858.7, Figure E-24.
 |
| Figure E-24 Second 861 ft Contour Point |
The process continues: enter a triangle on one side, exit on another; until the map edge is reached or the contour closes on itself, Figure E-25.
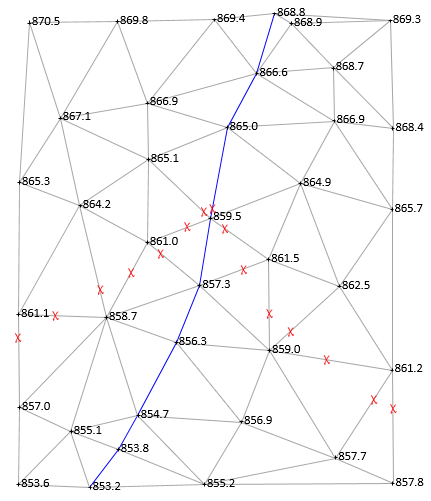 |
| Figure E-25 All 861 ft Contour Points |
When all interpolated positions have been determined, they are connected with straight line segments, Figure E-26.
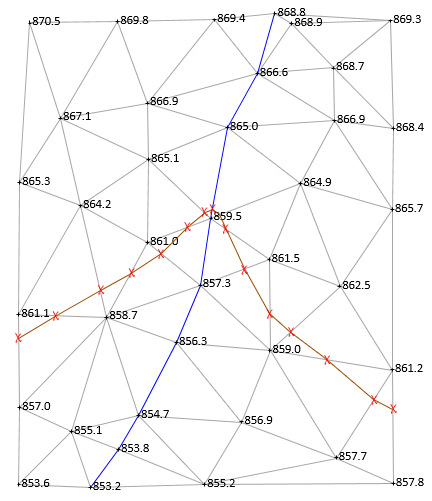 |
| Figure E-26 861 ft Contour Line |
Why straight line segments? Remember that each triangle is a flat 3D surface so from one edge to another is a straight line.
Each contour is similarly created: interpolate along triangle sides, then connect with straight lines. Adjacent contours tend to have similar configurations. In Figure E-27, the 860 ft and 862 ft contours have been created on both sides of 861 ft.
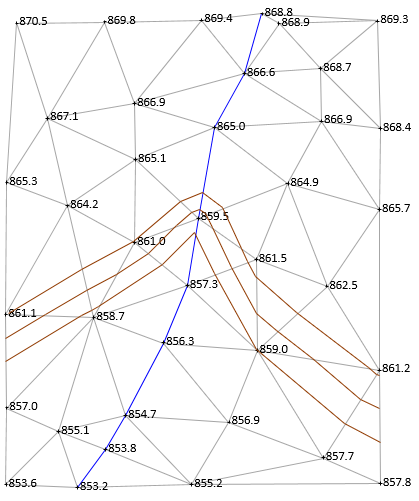 |
| Figure E-27 Adjacent Contours |
All three contours are similar. Also note their shape crossing the stream: V-shaped with the point of the V oriented upstream.
The remainder of the contours are drawn, Figure E-28.
 |
| Figure E-28 All Contours Drawn |
Figure E-29 are the contours with the TIN and points removed.
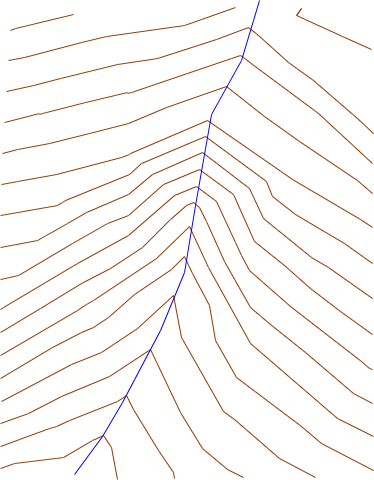 |
| Figure E-29 Contours with TIN and Points Removed |
The final version, Figure E-30, is cleaned up by editing and smoothing the lines a bit, darkening and labeling index contours and the stream.
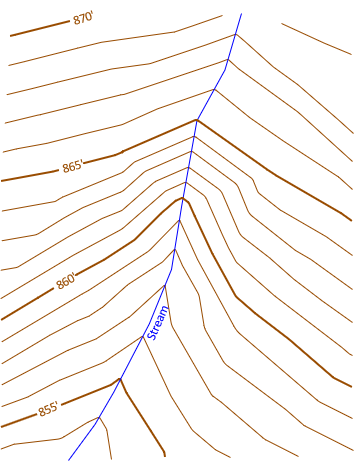 |
| Figure E-30 Final Clean contours. |
Smoothing contours is done to make them more natural looking. Except along man-made features, we don't expect them to be a series of straight line segments. However, over-smoothing, particularly in software, can cause problems: close contours lines may be bent enough to cross. The denser the data, the shorter the segments, and the more natural looking without (or with minimal) smoothing.