2. Interpolation
The ground slope between any two data points is assumed uniform which allows interpolation between them to locate contours. Figure E-1 is a subset of four three-dimensional (3D) data points.
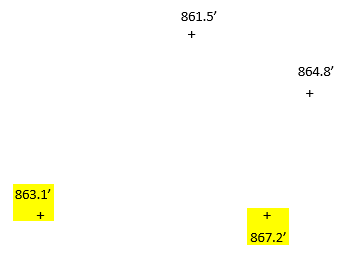 |
| Figure E-1 Data Points |
Each point is plotted at its horizontal location, indicated by the + symbol, and labeled with its elevation. The data will be used to create a two foot contour interval representation.
Starting with the two highlighted southern points, the 864 ft and 866 ft contour lines pass somewhere between them. Since a uniform slope is assumed, 864 ft and 866 ft would cross at proportional distances between the data points.
To interpolate:
The elevation difference is 867.2-863.1 = +4.1 ft
Measure the distance between the points, call it D.
From the 863.1 ft point to 864 ft:
Elev diff = 864-863.1 = +0.9 ftFrom the 863.1 ft point to 866 ft:
(dist/D) = (+0.9/+4.1); dist = (0.9/4.1)D
Elev diff = 866-863.1 = +2.9 ft
dist = (2.9/4.1)D
The interpolated points are shown in Figure E-2.
 |
| Figure E-2 864 ft and 866 ft Crossings |
Additional interpolations would be done between different combinations of coordinate pairs. Figure E-3 shows the results from interpolating around the perimeter.
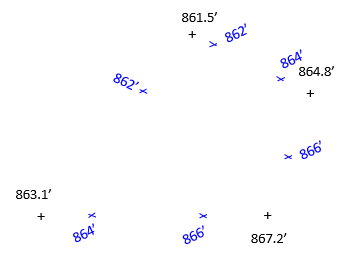 |
| Figure E-3 Perimeter Crossings |
Contour lines are drawn by connecting the respective interpolated points.
There are two issues with this method
- Lots of computations
- Interpolation pairs
Let's address these in turn.