4. Metric Character
A contour map drawn to a horizontal scale and with a uniform contour interval is a metric map. Measurements can be made with which computations can be performed. A hydrologist can use a contour map to determine rainfall runoff direction for planning stormwater management. A transportation engineer can compute grades and elevations of alternate road layouts. A land developer can determine site grading volumes.
Although the following examples are in terms of paper maps, digital versions can be used similarly albeit with different measurement tools.
a. Distance Example
Figure D-23 is another part of the Platteville area topoquad.
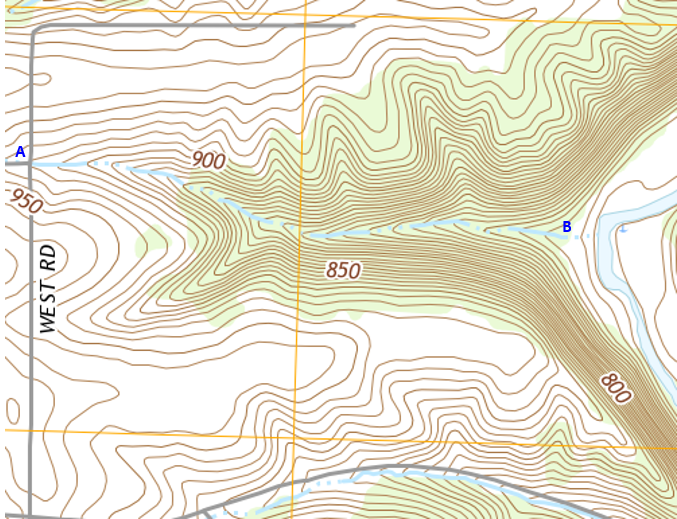 |
| Figure D-23 Platteville Area Topoquad |
Determine the average slope for the drainage channel from the road intersection at point A to the river floodplain at point B.
Measure the channel length in segments, Figure D-24.
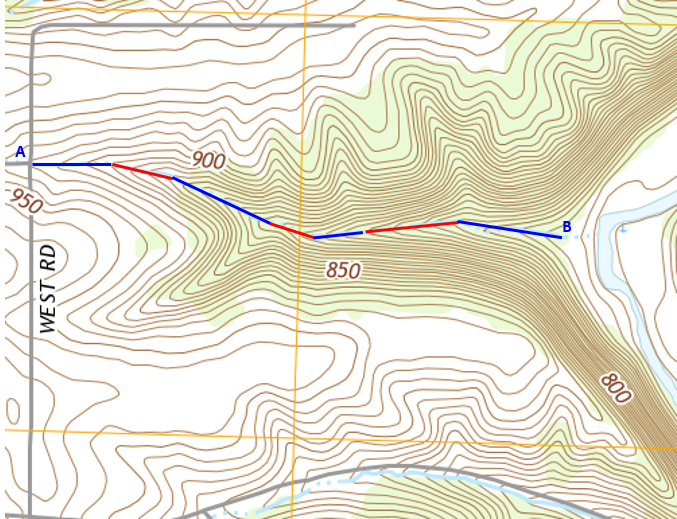 |
| Figure D-24 Channel Length Measurement |
Figure D-25(a) shows the channel segments; Figure D-25(b) is the segments aligned.
 |
| (a) As measured |
| (b) Aligned |
| Figure D-25 Channel Segments |
Using the graphic scale on the topoquad, Figure D-26, the length is ~4200 ft.
 |
| Figure D-26 Topoquad Graphic Scale |
Considering the measurement errors in each segment, rounding the distance to the smallest graphic division (200 ft) is reasonable.
Elevations can be interpolated to one-half the contour interval; this map's interval is 10 ft.
The elevation at point A is 920 ft, at point B 735 ft.
Slope, in percent, is (elevation difference) / (horizontal distance) x 100
Slope = (920 ft - 735 ft) / (4200 ft ) x 100 = -4.4%
b. Volume Example
Map measurements can support more complex calculations. For example, if an earthen dam with a top elevation of 800 ft were to be constructed perpendicular to the channel at the location shown in Figure D-27, what volume of water would be impounded before it spills over?
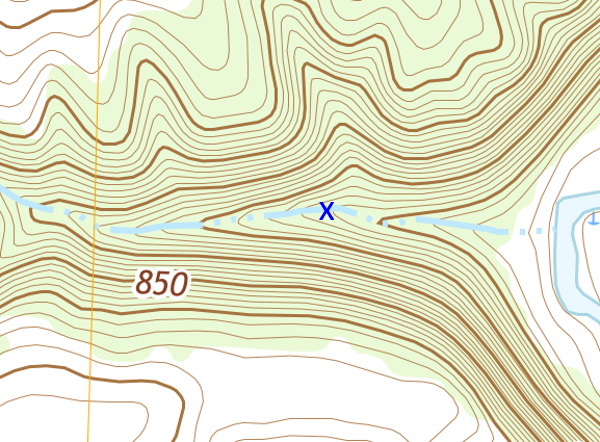 |
| Figure D-27 Dam Location |
Because its top elevation is 800 ft, the dam would intersect the 800 ft contour line on both sides of the channel, Figure D-28.
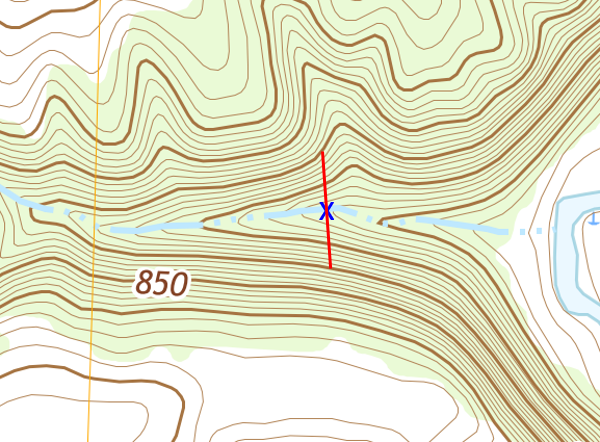 |
| Figure D-28 Dam Width |
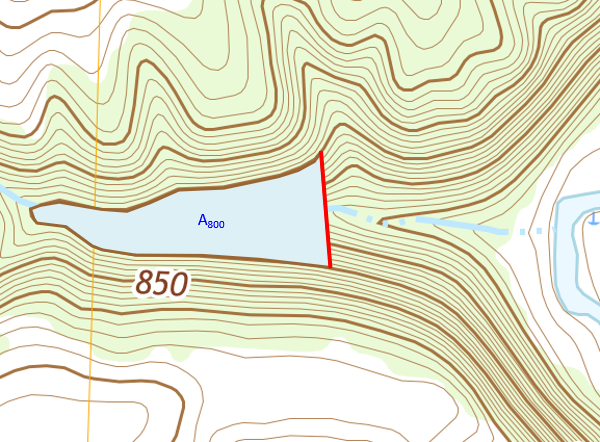
When full, the water elevation will be at 800 ft and its surface area defined by the dam and 800 ft contour line, Figure D-29.
 |
| Figure D-29 Full Impoundment |
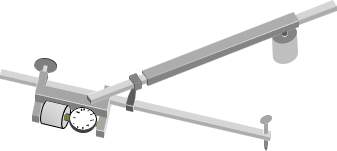
The surface area, A800, is measured on the map with a digital or mechanical planimeter, Figure D-30, tracing out the area bounded by the 800 ft contour and dam.
 |
|
Figure D-30 |
The next lower contour is 790 ft. The surface area bounded by the dam and 790 ft contour, A790, is measured, Figure D-31.
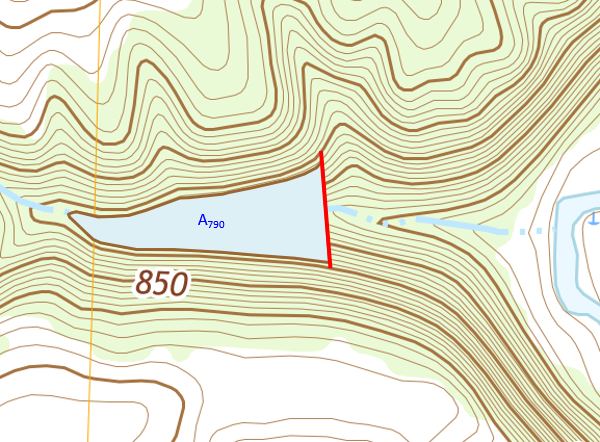 |
| Figure D-31 Surface Area at 790 Ft Elevation |
The volume of water between the two elevations is the average surface area multiplied by the contour interval:
Vol1 = (A800 + A790) / 2 x 10 ft
Each volume between adjacent contours is computed to the lowest impounded elevation and summed to determine the total volume, Figure D-32.
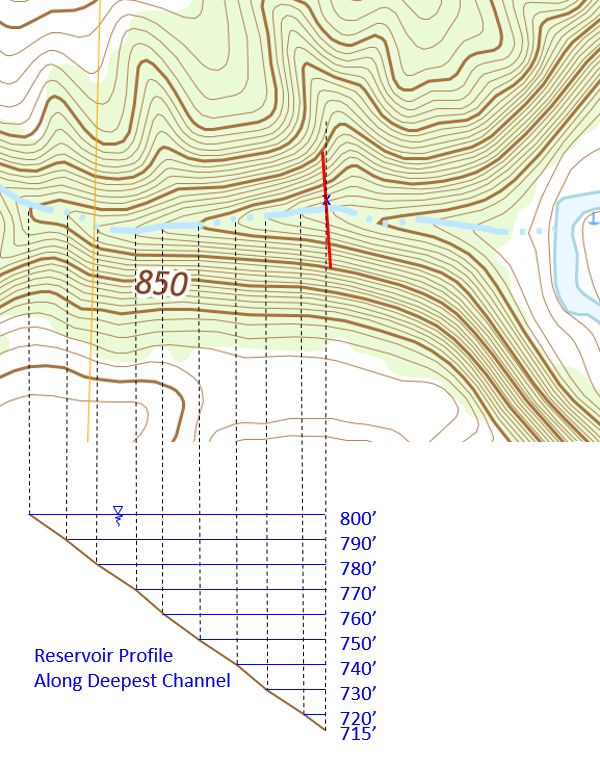 |
| Figure D-32 Reservoir Volume |
c. Measurement Accuracy
Measurement accuracy is affected by
- Contour interval
- Contour smoothness
- Horizontal scale
- Measuring device (instrumental and personal errors)
- Map purpose
- Data collection density and accuracy
In both examples, measurements and computations are only accurate enough for initial design alternative considerations; neither support detailed final design. Larger scale and higher resolution data is needed for design, important considerations for collecting data and new map compilation.