D. Contours: General
Contour lines are a common way to depict the earth's surface on a two-dimensional map. A topographic map with contours is metric because measurements can be made to determine three-dimensional spatial positions and quantities.
1. Terms; Definitions
a. Topography
Topography is the three dimensional earth surface. It has varying elevations and includes features such as hills, valleys, waterways, etc.
b. Topographic map
A topographic map is a two dimensional map which shows terrain variation using combinations of lines and colors.
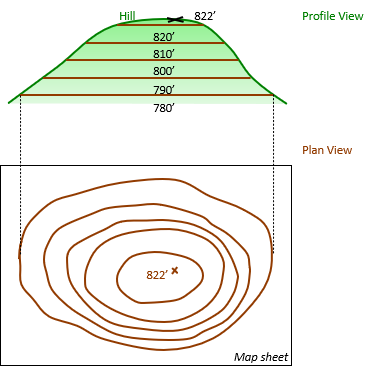
Figure D-1 Profile View is the side view of a hill feature with an 822 ft high point; Plan View will be the map representation of the terrain.
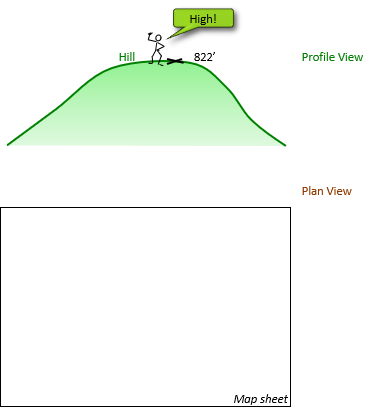 |
| Figure D-1 Hill |
Start by projecting the high point to the map, Figure D-2.
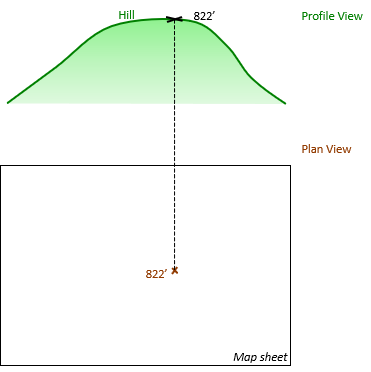 |
| Figure D-2 Projecting High Point |
c. Contour line
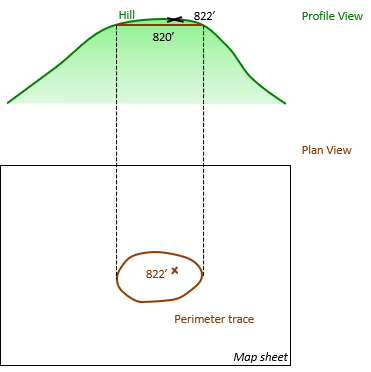
A contour line is a constant elevation line. There are a few ways to think of a contour line. For example, to create the 820 ft contour line:
- Stand at an point where the terrain elevation is 820 feet. From there walk along the terrain staying at 820 feet. You will eventually come back to the point at which you started. If you dropped a trail of bread cumbs while walking, they will represent the 820 ft elevation line.
- Pass a horizontal plane having an 820 ft elevation through the terrain. The perimeter trace of the plane-terrain intersection is the 820 ft contour line.
Figure D-3 Profile View shows 820 ft elevation plane (seen on-edge) passed through the hill; Plan View is the mapped perimeter trace of the plane-hill intersection.
 |
| Figure D-3 820 Ft Contour Line |
A contour line is a metric way to display terrain variation.
d. Contour interval
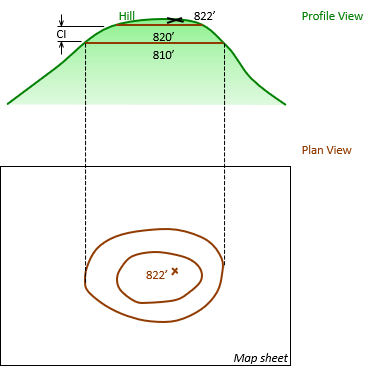
The vertical distance between adjacent contours is the contour interval (CI). It is uniform throughout the map.
The CI for Figure D-4 is 10 feet.
 |
| Figure D-4 810 Ft Contour Line |
A map's CI depends on map purpose, scale, terrain configuration, and data collection.
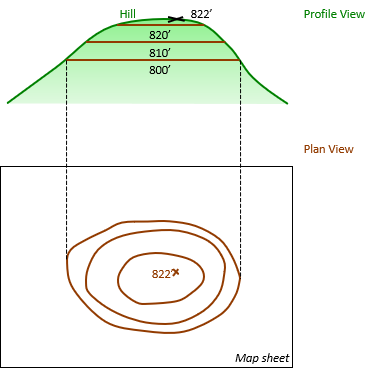
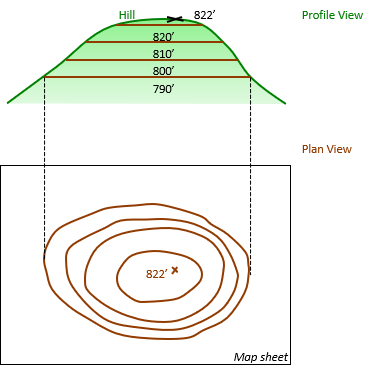
Figures D-5 through D-7 show the remaining contour lines being added.
 |
| Figure D-5 800 Ft Contour Line |
 |
| Figure D-6 790 Ft Contour Line |
 |
| Figure D-7 780 Ft Contour Line |
e. Index Contour
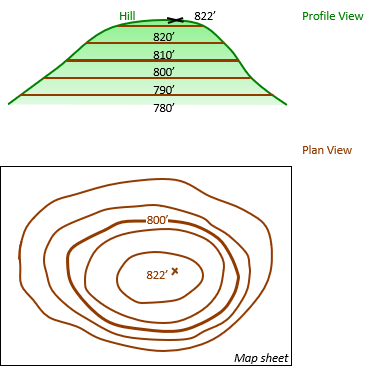
On most maps, labeling each contour line with its elevation would clutter the map and create too many line breaks. Traditionally, every fifth contour line is darkened and labeled with its elevation. These are Index Contours and provide the map user sufficient information, together with the CI, to determine the elevation of any contour line, Figure D-8.
 |
| Figure D-8 Index Contour |
Index contour values are selected to go through 100's
2 ft CI: 880, 990, 900, 910...;
5 ft CI: 675, 700, 725, ...;
10 ft CI: 950, 1000, 1050, 1100,...
2. Contour Properties
Because they represent real phenomena, mapped contour lines cannot do what real ones can't. This sounds simple, but basic errors are sometimes made creating contours manually or digitally.
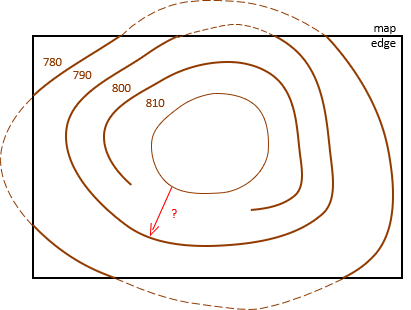
a. Closure
A contour line must eventually close back on itself. A contour line cannot just end or dangle. In Figure D-9 the red line cannot go from an 810 ft elevation to 790 ft without going through 800 ft.
 |
| Figure D-9 Contour Closure |
The only time a contour line can "end" is when it reaches the map edge. Our perspective of the line is limited by the map extent; the contour continues, shown dashed in Figure D-9.
b. Crossing
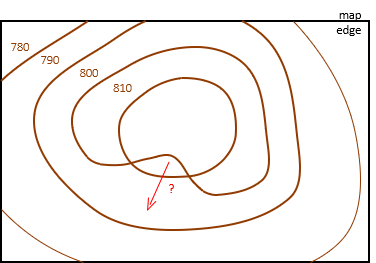
Contour lines generally cannot cross, Figure D-10.
 |
| Figure D-10 Crossing Contours |
This causes a few dilemmas. The red line starts at elevation 800 ft, goes up to 810 ft, then to down to 790 ft without passing through 800 ft again. Also, both points where the lines cross have two elevations separated by 10 ft.
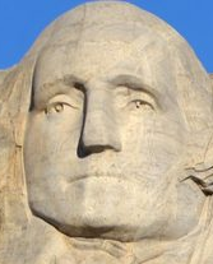
What about overhangs, like George Washington's nose and chin on Mount Rushmore, Figure D-11?
 |
| Figure D-11 George Washington |
Those are special and relatively isolated conditions. While contours can cross in those situations, the crossing contour is not technically visible and should be shown using a hidden line.
c. Coincidence
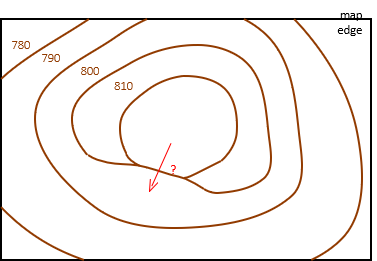
Except along man-made features, contour lines do not coincide for extended distances, Figure D-12.
 |
| Figure D-12 Coincident Contours |
Coincident contours indicate a perfectly vertical surface, something rarely occurring naturally. Due to weathering, even solid rock walls erode over time and lean causing contours to be close, but not coincident.
Man-made features, on the other hand, often have vertical surfaces and cause contours to run together.
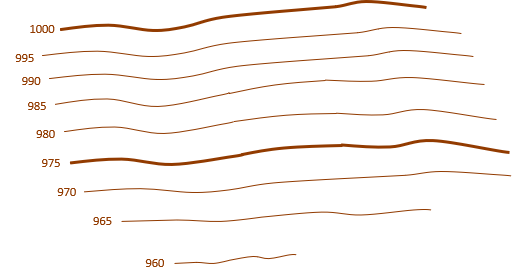
For example, let's start with a naturally sloped area, Figure D-13.
 |
| Figure D-13 Original Slope |
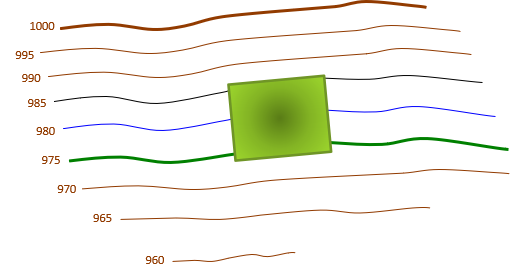
A building with vertical walls is added, Figure D-14.
 |
| Figure D-14 Building Added |
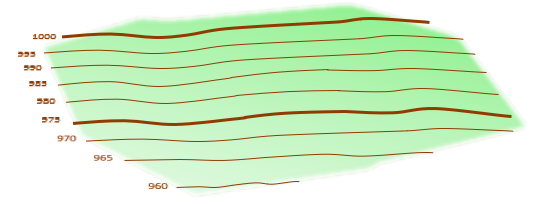
What happens to the 985 ft, 980 ft, and 975 ft contours? It looks like they end.
Figure D-15 is a perspective view of the area.
 |
| Figure D-15 Original Slope Perspective |
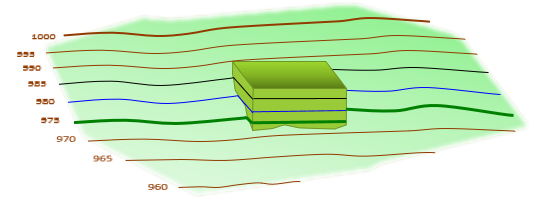
To it is added the building, Figure D-16.
 |
| Figure D-16 Building Added Perspective |
It can be seen in this view that the 985 ft, 980 ft, and 975 ft contours intersect the building's vertical walls, run around them, then continue along the terrain on the other side. Where the contours run along the building walls, they coincide on the map in Figure D-14.
d. Branching
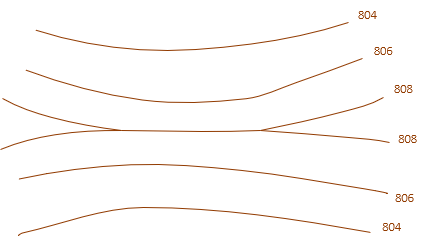
Contour lines can't branch or split. In Figure D-17, the 808 ft contour indicates a knife-edge ridge at exactly 808 ft elevation.
 |
| Figure D-17 Branching Contours |
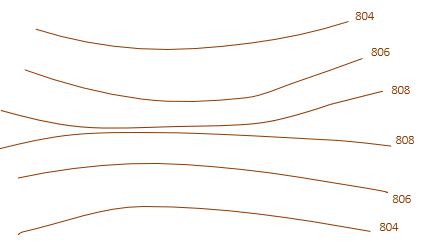
If the elevations were reversed, it would be a valley at an exact elevation. Neither condition is common in nature due to weathering. Contours usually closely straddle a ridge top (or valley). In Figure D-18, the ridge tops out higher than 808 ft.
 |
| Figure D-18 Straddling Contours |
f. Non-mathematical
Naturally occurring contour lines are neither mathematical curves nor are they straight and parallel. Along manmade features however, quite often the contours are mathematical and have uniform orientation.
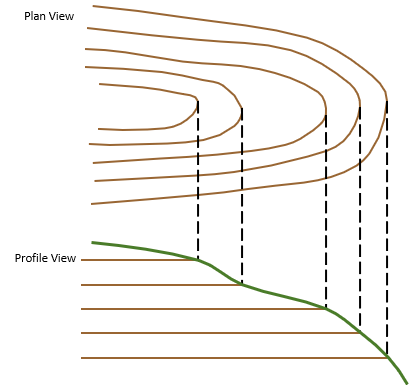
Figure D-19 shows the Plan (top) and Profile (front) Views of a ridge section.
|
|
| Figure D-19 Ridge Section |
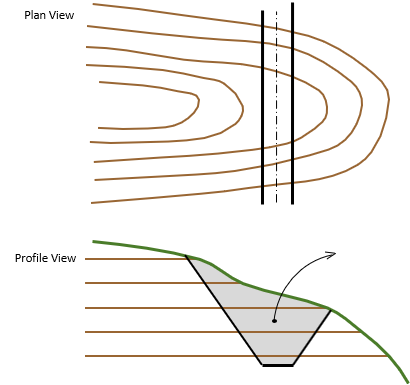
A road will be run through the ridge. The Plan View in Figure D-20 shows the road location, the Profile View shows the road and its side slopes.
|
|
| Figure D-20 Proposed Road |
The side slopes have a uniform slope to provide bank stability. The grayed area shows the part of the ridge that must be excavated to construct the road.
Figure D-21 shows the ridge accounting for the road.
 |
| Figure D-21 Post-Construction Topography |
The excavated area in the Profile View removes part of the ridge changing the contours. The reconfigured contours are shown in the Plan View. They are uniformly spaced, because of the uniform side slopes, and parallel with the road.
3. Terrain Identification
Contour line configurations over an area allow quick identification of terrain features.
a. Contour Spacing
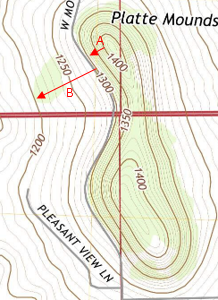
Contour line spacing indicates steepness or grade. Closer contours indicate a steeper surface than contours further apart.
In Figure D-22, Line A is steeper than Line B; both have the same elevation change, but Line A does it over a shorter distance.
 |
| Figure D-22 Contour Spacing |
The steepest slope is perpendicular to contour lines.
b. Major Features
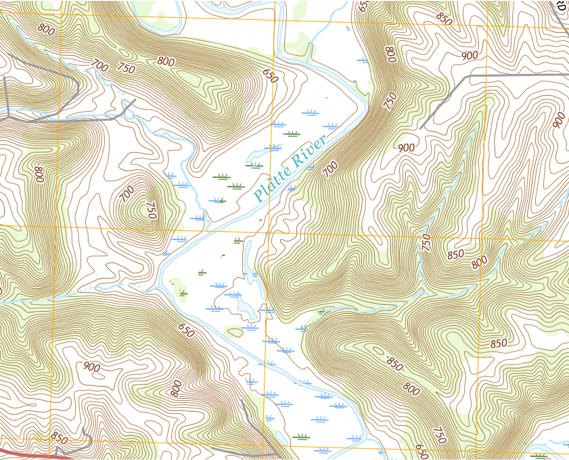
Southwestern Wisconsin, where the City of Platteville is located, is in the Driftless Area, a non-glaciated part of the state. Because glaciers did not scour the area, terrain is relatively rugged (by Midwestern standards) consisting of many valleys and ridges.
Figure D-21 is a portion of topoquad area southwesterly of Platteville.
 |
| Figure D-21 Platteville Area Topoquad |
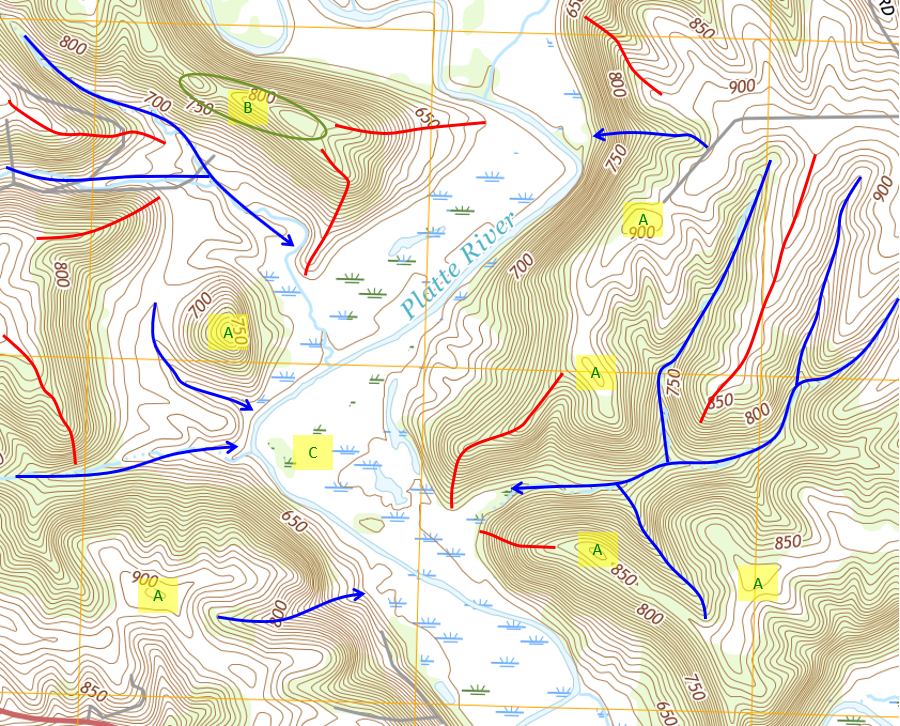
Figure D-22 indicates some major terrain features which can be identified from the contour line configurations.
 |
| Figure D-22 Terrain Features |
Blue lines are streams and valleys. Arrows show downhill or flow directions. Contours crossing streams and valleys are typically V-shaped with the bottom of the V pointing upstream.
Red lines are ridges, located between stream and valleys. Contours on ridges are generally U-shaped with the open part of the U pointing uphill.
Concentric contours indicate hilltops or depressions, depending if elevations increase or decrease inwardly. Hilltops are labeled A in Figure D-22.
A saddle, B, is two hilltops close to each other separated by a valley.
The ridges and valleys have closely spaced contours indicating steep slopes. Running north-south through the area is the Platte River, a major waterway. The area around the river is its flat floodplain so has very few contours, C.
4. Metric Character
A contour map drawn to a horizontal scale and with a uniform contour interval is a metric map. Measurements can be made with which computations can be performed. A hydrologist can use a contour map to determine rainfall runoff direction for planning stormwater management. A transportation engineer can compute grades and elevations of alternate road layouts. A land developer can determine site grading volumes.
Although the following examples are in terms of paper maps, digital versions can be used similarly albeit with different measurement tools.
a. Distance Example
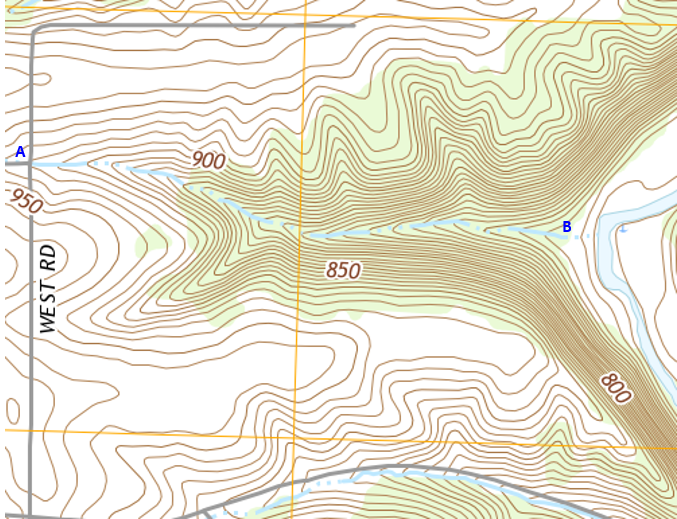
Figure D-23 is another part of the Platteville area topoquad.
 |
| Figure D-23 Platteville Area Topoquad |
Determine the average slope for the drainage channel from the road intersection at point A to the river floodplain at point B.
Measure the channel length in segments, Figure D-24.
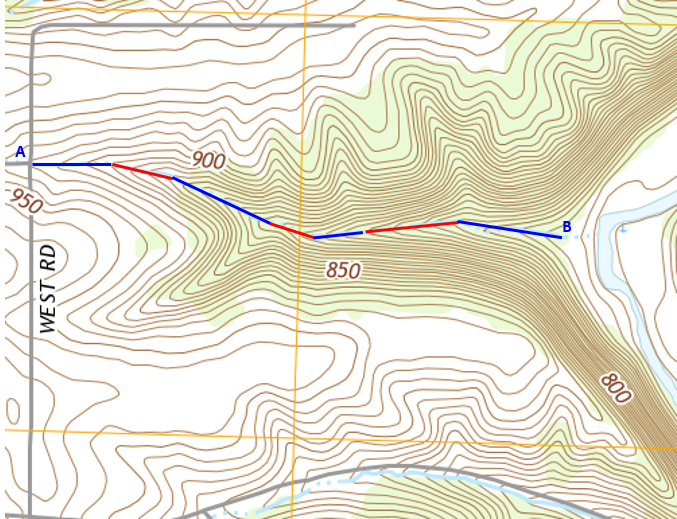 |
| Figure D-24 Channel Length Measurement |
Figure D-25(a) shows the channel segments; Figure D-25(b) is the segments aligned.
 |
| (a) As measured |
| (b) Aligned |
| Figure D-25 Channel Segments |
Using the graphic scale on the topoquad, Figure D-26, the length is ~4200 ft.
 |
| Figure D-26 Topoquad Graphic Scale |
Considering the measurement errors in each segment, rounding the distance to the smallest graphic division (200 ft) is reasonable.
Elevations can be interpolated to one-half the contour interval; this map's interval is 10 ft.
The elevation at point A is 920 ft, at point B 735 ft.
Slope, in percent, is (elevation difference) / (horizontal distance) x 100
Slope = (920 ft - 735 ft) / (4200 ft ) x 100 = -4.4%
b. Volume Example
Map measurements can support more complex calculations. For example, if an earthen dam with a top elevation of 800 ft were to be constructed perpendicular to the channel at the location shown in Figure D-27, what volume of water would be impounded before it spills over?
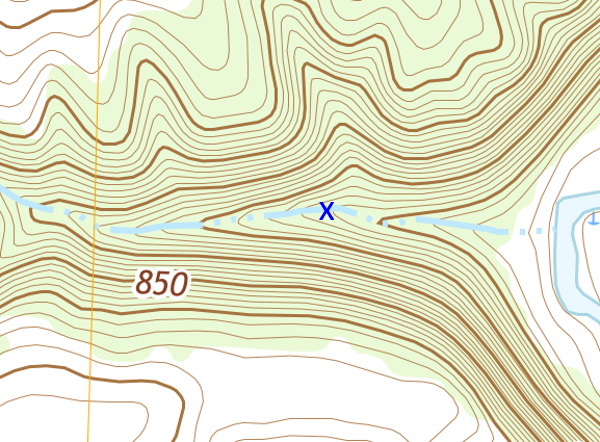 |
| Figure D-27 Dam Location |
Because its top elevation is 800 ft, the dam would intersect the 800 ft contour line on both sides of the channel, Figure D-28.
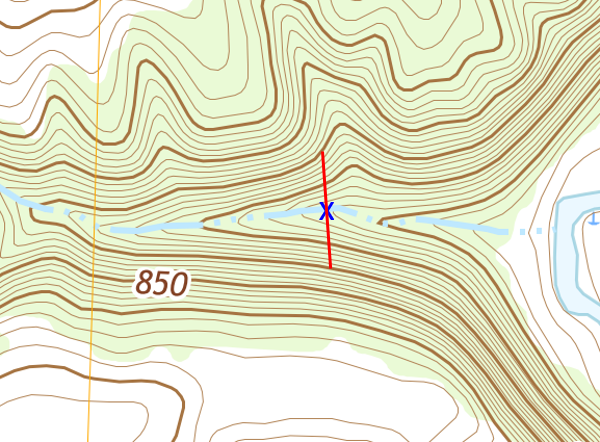 |
| Figure D-28 Dam Width |
When full, the water elevation will be at 800 ft and its surface area defined by the dam and 800 ft contour line, Figure D-29.
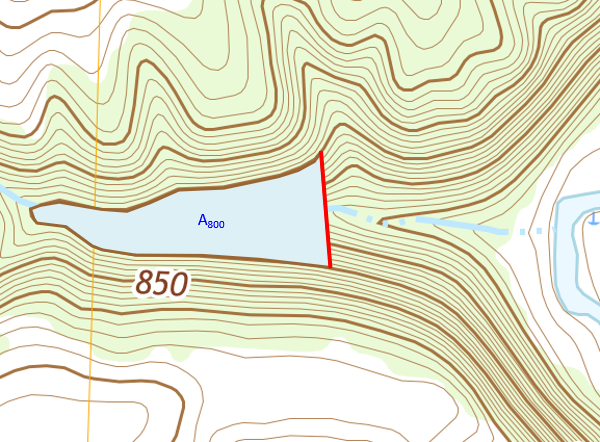 |
| Figure D-29 Full Impoundment |
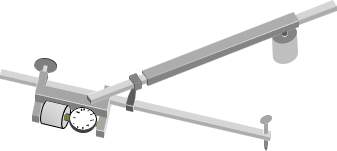
The surface area, A800, is measured on the map with a digital or mechanical planimeter, Figure D-30, tracing out the area bounded by the 800 ft contour and dam.
 |
|
Figure D-30 |
The next lower contour is 790 ft. The surface area bounded by the dam and 790 ft contour, A790, is measured, Figure D-31.
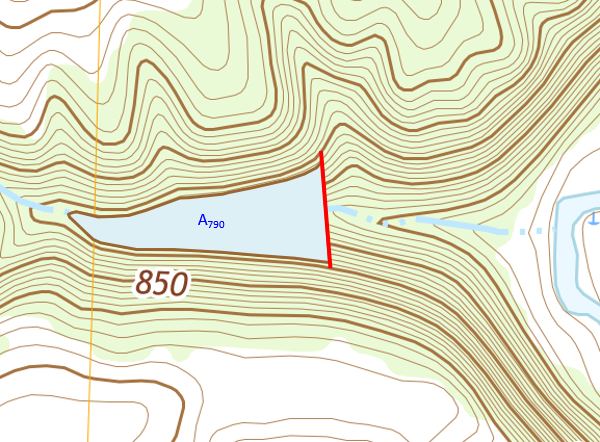 |
| Figure D-31 Surface Area at 790 Ft Elevation |
The volume of water between the two elevations is the average surface area multiplied by the contour interval:
Vol1 = (A800 + A790) / 2 x 10 ft
Each volume between adjacent contours is computed to the lowest impounded elevation and summed to determine the total volume, Figure D-32.
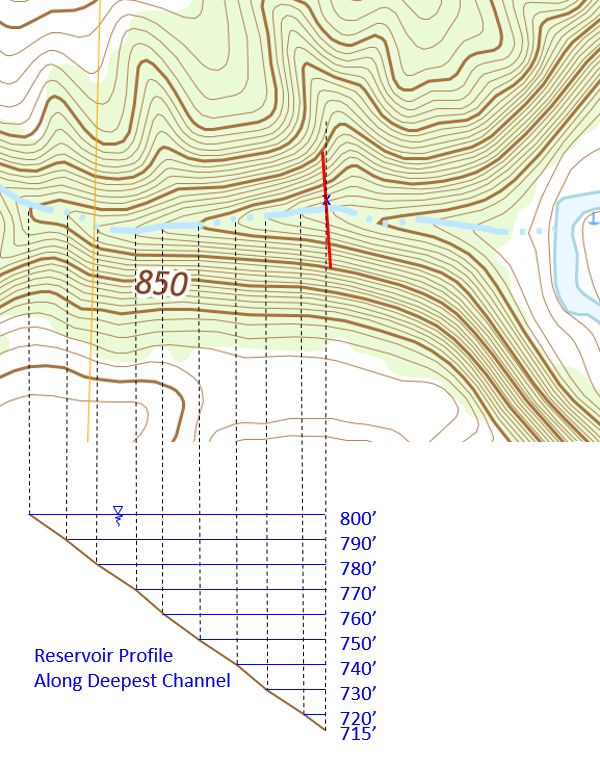 |
| Figure D-32 Reservoir Volume |
c. Measurement Accuracy
Measurement accuracy is affected by
- Contour interval
- Contour smoothness
- Horizontal scale
- Measuring device (instrumental and personal errors)
- Map purpose
- Data collection density and accuracy
In both examples, measurements and computations are only accurate enough for initial design alternative considerations; neither support detailed final design. Larger scale and higher resolution data is needed for design, important considerations for collecting data and new map compilation.
