1. Terms; Definitions
a. Topography
Topography is the three dimensional earth surface. It has varying elevations and includes features such as hills, valleys, waterways, etc.
b. Topographic map
A topographic map is a two dimensional map which shows terrain variation using combinations of lines and colors.
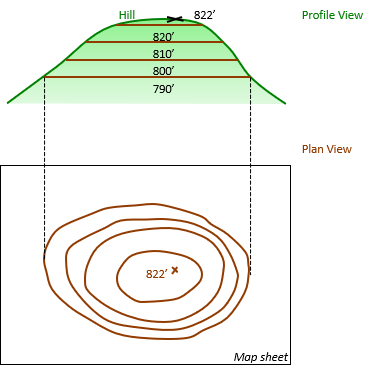
Figure D-1 Profile View is the side view of a hill feature with an 822 ft high point; Plan View will be the map representation of the terrain.
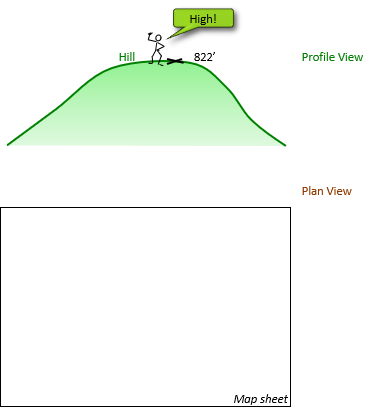 |
| Figure D-1 Hill |
Start by projecting the high point to the map, Figure D-2.
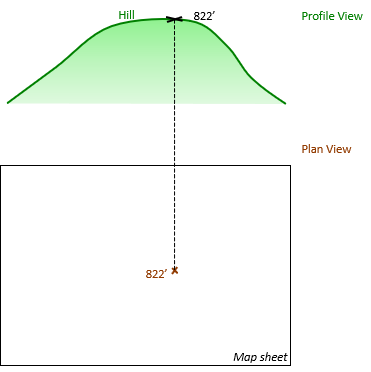 |
| Figure D-2 Projecting High Point |
c. Contour line
A contour line is a constant elevation line. There are a few ways to think of a contour line. For example, to create the 820 ft contour line:
- Stand at an point where the terrain elevation is 820 feet. From there walk along the terrain staying at 820 feet. You will eventually come back to the point at which you started. If you dropped a trail of bread cumbs while walking, they will represent the 820 ft elevation line.
- Pass a horizontal plane having an 820 ft elevation through the terrain. The perimeter trace of the plane-terrain intersection is the 820 ft contour line.
Figure D-3 Profile View shows 820 ft elevation plane (seen on-edge) passed through the hill; Plan View is the mapped perimeter trace of the plane-hill intersection.
 |
| Figure D-3 820 Ft Contour Line |
A contour line is a metric way to display terrain variation.
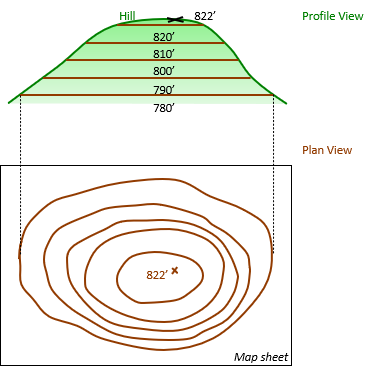
d. Contour interval
The vertical distance between adjacent contours is the contour interval (CI). It is uniform throughout the map.
The CI for Figure D-4 is 10 feet.
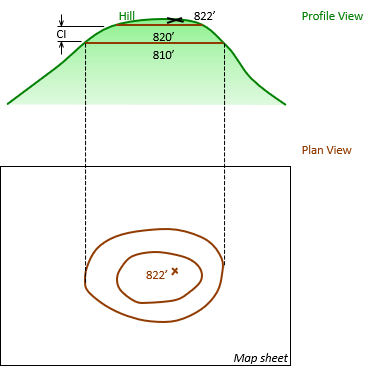 |
| Figure D-4 810 Ft Contour Line |
A map's CI depends on map purpose, scale, terrain configuration, and data collection.
Figures D-5 through D-7 show the remaining contour lines being added.
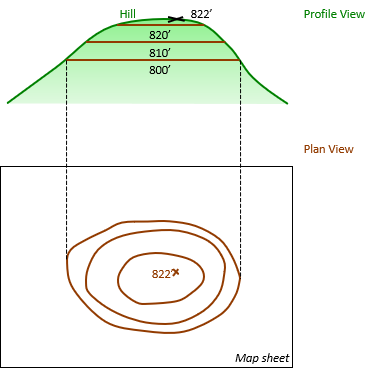 |
| Figure D-5 800 Ft Contour Line |
 |
| Figure D-6 790 Ft Contour Line |
 |
| Figure D-7 780 Ft Contour Line |
e. Index Contour
On most maps, labeling each contour line with its elevation would clutter the map and create too many line breaks. Traditionally, every fifth contour line is darkened and labeled with its elevation. These are Index Contours and provide the map user sufficient information, together with the CI, to determine the elevation of any contour line, Figure D-8.
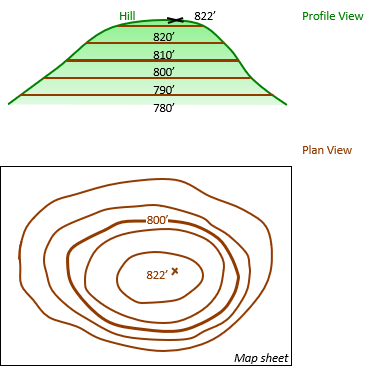 |
| Figure D-8 Index Contour |
Index contour values are selected to go through 100's
2 ft CI: 880, 990, 900, 910...;
5 ft CI: 675, 700, 725, ...;
10 ft CI: 950, 1000, 1050, 1100,...