Chapter D. Vertical Datum
1. Historical Background
a. Equipotential Surfaces
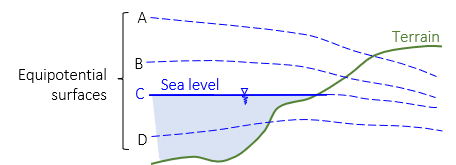
A vertical datum should be one that is a true equipotential surface. It may not be perfectly smooth, but it should represent equal force balancing. How many equipotential surfaces are there? Lots - an infinite number of them, Figure D-1.
 |
| Figure D-1 Equipotential Surfaces |
They are similar (although not identical) and have the typical oblate shape. They aren't physical surfaces, just different levels of energy.
So which one to use for a datum surface? Only one of them can be the geoid.
b. Finding Sea Level
It was mentioned earlier that a lake's surface on a calm windless day is an equipotential surface. Using a lake surface as a datum makes it relatively easy to determine elevations around its periphery. For initial vertical datum creation oceans were used - sea level would represent the geoid, Figure D-2.
 |
| Figure D-2 Sea Level Surface |
The problem with a water surface is that its height varies due to a number of factors. Chief among them are the effects of the sun and (especially) the moon. Because the moon passes over the Earth the gravitational attraction between the two changes. Their effects are threefold:
- Semidiurnal - a period of approximately half a day
- Diurnal - a period of approximately one day
- Long-period - a period of a month or more.
Other things affecting water surface height:
- Tide currents caused by the rise and fall of the tide. The currents aren't uniform, slowly increasing then decreasing causing nonlinear inertial shifts.
- During the course of a year, the Earth's distance to the Sun changes varying the gravitational attraction.
- The seas are constantly replenished by freshwater streams and rivers causing local water surface height increases.
- Meteorological conditions: wind, atmospheric pressure, etc.
In order to establish a average sea level surface, heights had to be determined at multiple locations for the Atlantic and Pacific. Tide stations were established along coastal areas surrounding the country, Figure D-3: 21 in the US and 5 in Canada by 1929. Because such a large area was covered, conditions at each tide station would differ affecting water surface height. Water height was monitored and recorded at each location over periods long enough to allow cyclic errors. These tended to average out to establish the average 0-foot elevation surface: Mean Sea Level (MSL).
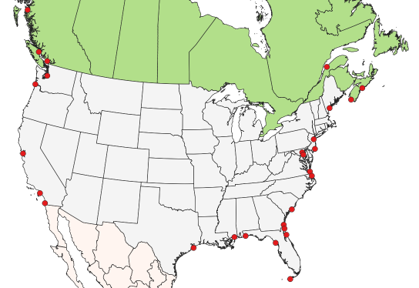 |
| Figure D-3 Tide Stations |
How long was data collected?
"A period of 19 years is generally considered as constituting a full tidal cycle, for during this period of time the more important of the tidal variations will have gone through complete cycles. It is therefore customary to regard results derived from 19 years of tide observations as constituting mean values. Hence sea level derived from 19 years of observations may be taken to constitute a primary determination and as giving accurately the datum of mean sea level."
Special Publication No. 135, Tidal Datum Planes, 1951, H.A. Marmer
Wow - 19 years.
c. Measuring Tide
Tide stations had a way to measure water surface height along with a nearby bench mark to tie to. The earliest systems required an operator to make and record readings manually. The simplest was a numbered staff, like a level rod, mounted so that water surface heights could be directly read, Figure D-4.
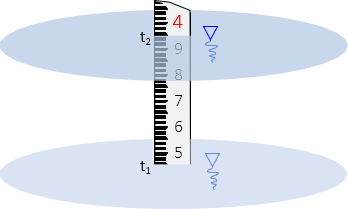 |
| Figure D-4 Staff Reading |
Another was a box gauge, Figure D-5, which had a float attached to a graduated rod. The float was inside a tube to prevent wave motion effect. Rod readings changed as the float rose and fell reacting to the water surface.
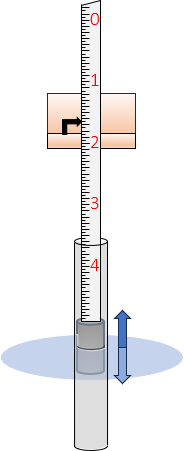 |
| Figure D-5 Box gauge |
Readings were recorded hourly, down to 15 minute intervals bracketing high and low tide events. Figure D-6 is an example of a manually recorded tide sheet.
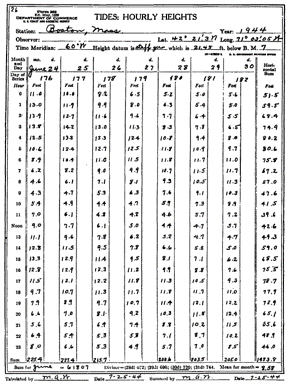 |
| Figure D-6 Tide Sheet |
Automatic tide gauges, Figure D-7, came into use near the beginning of the twentieth century.
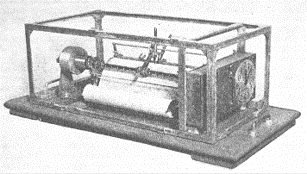 |
| Figure D-7 Automatic Tide gauge1 |
1 Special Publication No. 135, Tidal Datum Planes, 1951, H.A. Marmer
An automatic tide gauge consisted of a clock that rotated a roll of paper at a uniform rate. A pencil would trace on paper the rise and fall of a connected float. The result was a continuous tide curve from which the surface elevation could be determined at any time, Figure D-8.
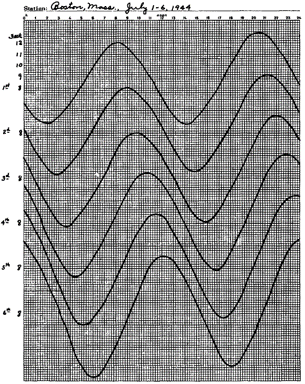 |
| Figure D-8 Tide Curve |
d. Defining the Datum
MSL at a tide station was just the average of the tide heights over the total observation period. The nearby bench mark's elevation could then be expressed in MSL at that location.
Level circuits were run between the bench marks and adjusted to create an integrated vertical control network. The network was densified and adjusted until 1929 creating these vertical datums:.
- First General Adjustment - 1899
- Second General Adjustment - 1903
- Third General Adjustment - 1907
- Fourth General Adjustment - 1912
- Sea Level Datum of 1929
Figure D-9 is a map of the First-Order leveling network making up the 1929 adjustment.
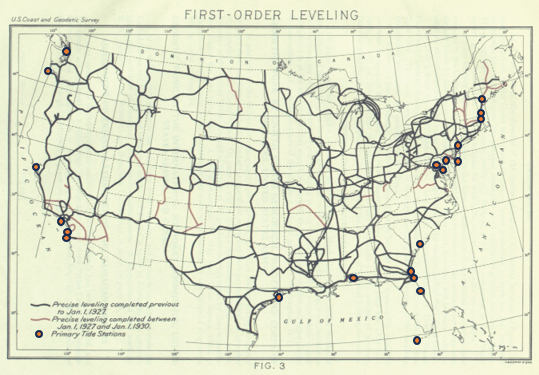 |
| Figure D-9 First-Order Networks - 19292 |
2 Special Publication No. 166 Geodetic Operations in the United States Jan 1, 1927 to Dec 31, 1929, Bowe.
The network consisted of ~100,000 bench marks and 106,724 km of leveling.
So that's how to create a Sea Level datum.
OK, so it was more complicated and involved than the brief description here, but that's the gist of it.
e. National Geodetic Vertical Datum of 1929 (NGVD 29)
What is the relationship between the Sea Level Datum of 1929 and NGVD 29?
The bench mark elevations of Sea Level Datum of 1929 were fixed and held until the decision to update the datum in the late 1970s. Many, many more control circuits were run and using increasingly more accurate equipment, Often the surveying accuracy exceeded that of the control network - accurate circuits were forced to fit less accurate control.
In its description of the National Geodetic Vertical Datum of 1929, NGS said about the Sea Level Datum of 1929:
"The datum was not mean sea level, the geoid, or any other equipotential surface. Therefore, it was renamed in 1973, the National Geodetic Vertical Datum of 1929. "
Despite all the tide gauge measurements and connecting circuits, "mean" sea level wasn't achieved and the adopted datum wasn't the geoid. A big part of the problem was that there was too much variation of "mean" sea level between all the tide stations.
So it wouldn't be correct to call the datum "Sea Level", mean or otherwise.