Page 3 of 3
3. Example
From the adjusted network of Chapter E Section 6, Figure G-13, determine the standard error ellipse and 95% CI for each adjusted point.
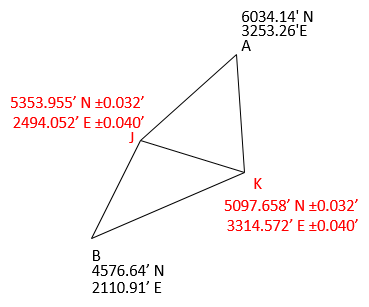 |
| Figure G-13 Adjusted Network |
The network had three DF and a So of ±2.136'. The last covariance matrix was:
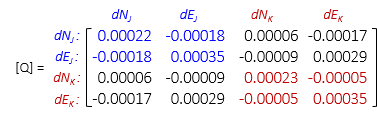
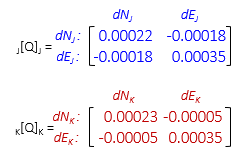
a. Sub-Matrices
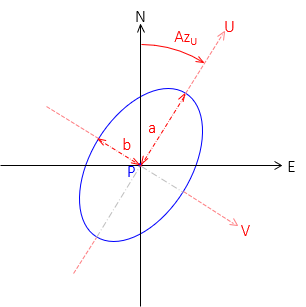
b. AzU of Each Error Ellipse
Point J

Point K

c. Rotated Covariance Matrices Diagonal Elements
Point J

Point K

d. Standard Error Ellipse Parameters
Point J

Point K

e. 95% CI Error Ellipse Parameters
Table G-2: At 3 DF, F Statistic = 9.55
Point J
![]()
Point K
![]()
f. Summary
| Point | AzU | a, SU | b, SV | 95% SU | 95% SV |
| J | 215°04' | ±0.046' | ±0.021' | ±0.201' | ±0.092' |
| K | 199°54' | ±0.041' | ±0.031' | ±0.179' | ±0.135' |