G. Error Ellipses
1. Introduction
Each adjusted position has uncertainty based on measurement random errors. A single dimension elevation has a vertical uncertainty, ±SElevP, Figure G-1.
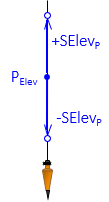 |
| Figure G-1 Elevation Uncertainty |
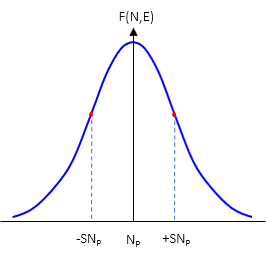
Recall that the standard deviation of a normal distribution is approximately 68% under the symmetric bell-shaped distribution curve, Figure G-2.
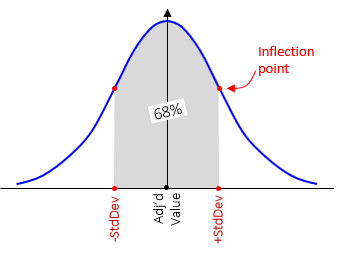 |
| Figure G-2 Normal Distribution |
Standard deviation represents a 68% confidence interval. In Figure G-1, we have a 68% confidence the "true" elevation is within ±SElevP of the adjusted value ElevP.
A two dimension horizontal position has two uncertainties: one north, SNP, one east, SEP, Figure G-3.
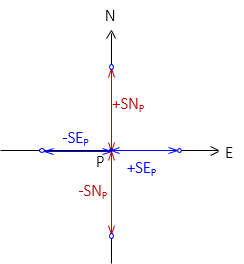 |
| Figure G-3 Horizontal Uncertainties |
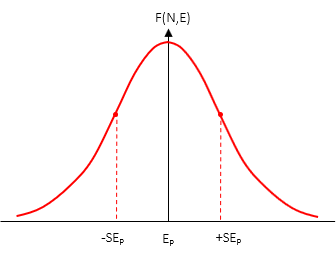
A horizontal position has two normal distribution curves, Figure G-4, corresponding to each direction.
 |
 |
| (a) North | (b) East |
| Figure G-4 Horizontal Position Normal Curves |
|
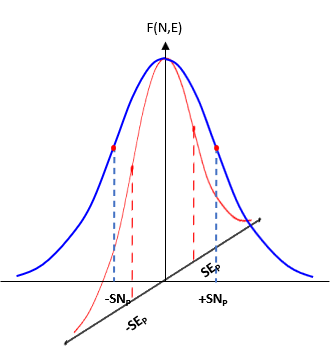
Even though each direction can have a different standard deviation, the two distributions are dependent on each other. They are related by the two dimensional measurements that define the position. Instead of a single simple normal distribution, the expected positional error is a bivariate normal distribution. Combining both curves, Figure G-5, creates the three dimensional bivariate distribution.
 |
| Figure G-5 Bivaraiate Distribution |
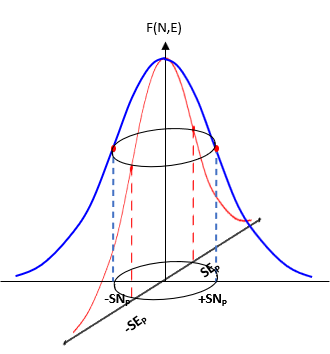
The perimeter trace of horizontal "slice" through the bivariate distribution is an ellipse, Figure G-6.
 |
| Figure G-6 Error Ellipse |
There are an infinite number of error ellipses, each representing a confidence region centered on the adjusted position. The standard error ellipse is the defined by the standard deviations in the North and East directions.