b. Map Types
For purposes of this topic, we will define three map types based on primary purpose or feature information:
- Planimetric
- Topographic
- Legal
Theses are pretty broad and most maps contain characteristics of multiple types.
(1) Planimetric
The primary emphasis of a planimetric map is horizontal locations of features. The features themselves may be exaggerated for visibility but their locations with respect to other features are correctly depicted.
A road map, Figure A-5, is a good example. At a glance, the user can tell which roads connect municipalities and determine preliminary travel routes. This is a metric map because distances can be determined by measuring along roads.
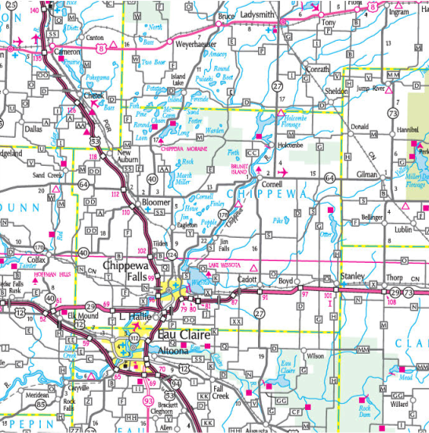 |
| Figure A-5 Road Map |
Figure A-6 is another planimetric map, this one a hand drawn map of major features in relationship to a buried "treasure". It's non-metric: accurate measurements can't be made to locate the treasure. The map depends more on relative spatial interpretation than absolute location to convey its information.
 |
| Figure A-6 Treasure Map |
(2) Topographic
A topographic map communicates elevation or surface information. The challenge is to depict earth's third dimension on a traditional two-dimensional map.
One way is to exaggerate terrain characteristics and filter out distracting data. Figure A-7 uses color intensity and shade to emphasize slopes. The user sees the surface variation across the state and how major waterways relate to the terrain. Distractions such as roads, cities, etc, are not included in order to emphasize terrain.
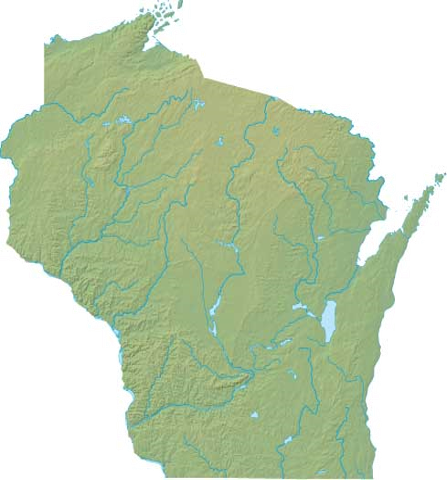 |
| Figure A-7 Shaded Terrain Map |
While an effective way to convey topography, particularly with use of color, the map is non-metric. It is not possible to determine elevation dependent quantities from the map: volumes, slopes, etc. We have a visual impression, but no quantifiable representation.
Another way to depict topography is using contour lines, Figure A-8. A contour is a line of constant elevation which appears only on the map, not on the ground (you can't trip over a contour line).
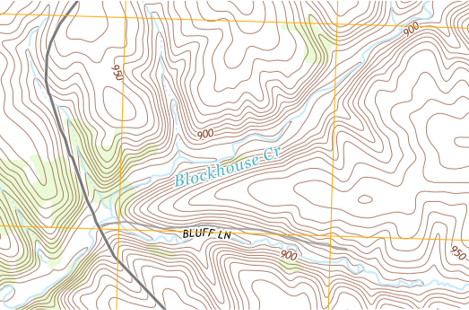 |
| Figure A-8 Contour Map |
A contour map is a metric map. The vertical distance between adjacent contour lines is constant (contour interval). We can draw a line on the map and determine its slope based on the number of contour lines crossed along its length. Volumes can be determined using the areas enclosed by contours. Contour lines are a common way to show surface configuration.
We will discuss contour lines in a a later chapter including characteristics, compilation, and data collection.
(3) Legal
A legal map is a special kind of planimetric map with an emphasis on parcel boundaries. Legal ownership claims and rights change when a parcel boundary is crossed. Like contours, a boundary is often not a physical line on the ground. Unlike most contour maps, however, a legal map affects property ownership.
A legal map either creates new boundaries or shows results of re-establishing old boundaries from records and physical evidence. Because property rights are involved, all states require a surveyor be licensed to create or re-establish property lines.
Figure A-9 is a Certified Survey Map (CSM), a type of legal map in Wisconsin used to create up to 4 new parcels.
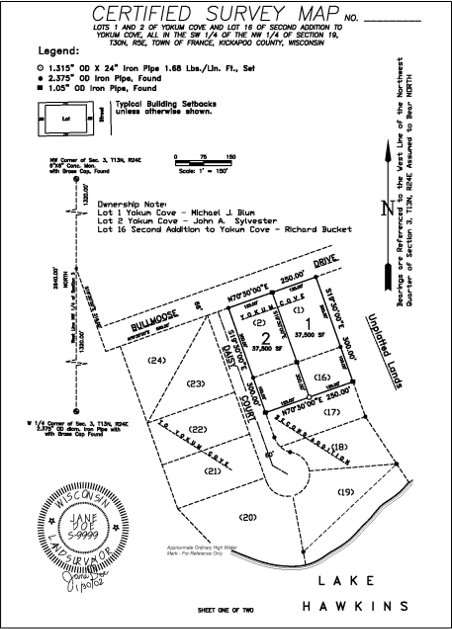 |
| Figure A-9 Certified Survey Map |
The content and format of many legal maps are defined by laws of the respective jurisdiction.
(4) Combinations
Most maps combine various elements of the three types to more effectively convey information.
For example. Figure A-10 is a legal map of a proposed subdivision.
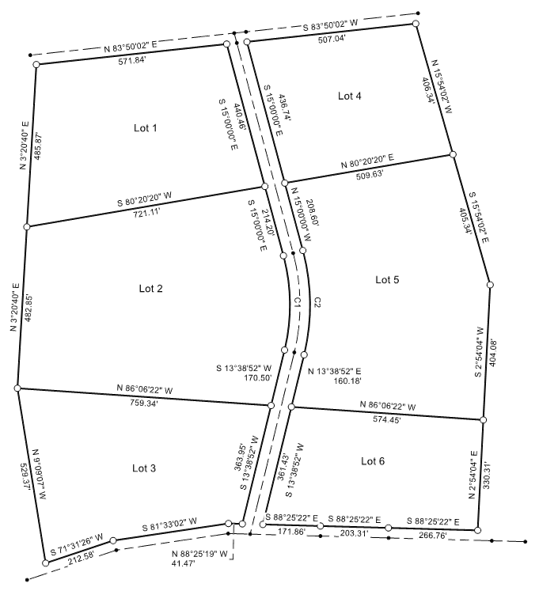 |
| Figure A-10 Subdivision Map |
While it shows property boundaries required by law, it doesn't really provide much information about the rest of the area.
Adding planimetric data, Figure A-11, conveys more information. An overhead power line runs through Lots 1 and 4, a stream through Lots 2, 3, and 5. We can also see where various types of trees are located.
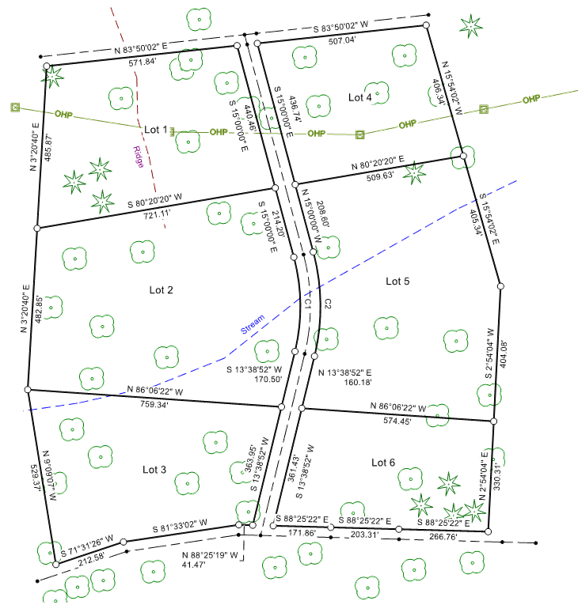 |
| Figure A-11 Subdivision Map with Planimetry |
Finally, including topographic data, Figure A-12, helps identify where slopes may be an issue or site grading might be needed.
|
|
| Figure A-12 Subdivision Map with Planimetry and Contours |
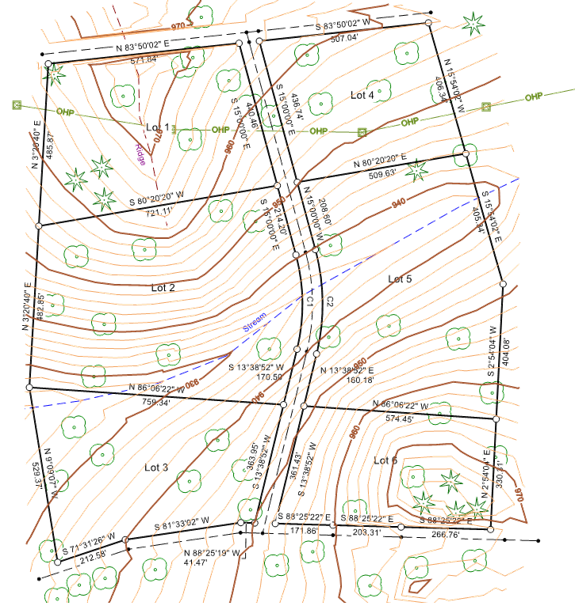
Lots 1 and 6 will probably require material removal to create a level building site; Lot 5 is dominated by a valley with the stream at its center. Because it is a metric map, we can estimate earthwork volumes and design a stream crossing for the new street.
The more information contained on a map, the more decisions it can support.
On the other hand, too much information can make the map hard to interpret or use. In Figure A-13 minimum building setback lines, soil boundaries, and floodplain limits have been added. It starts to become confusing.
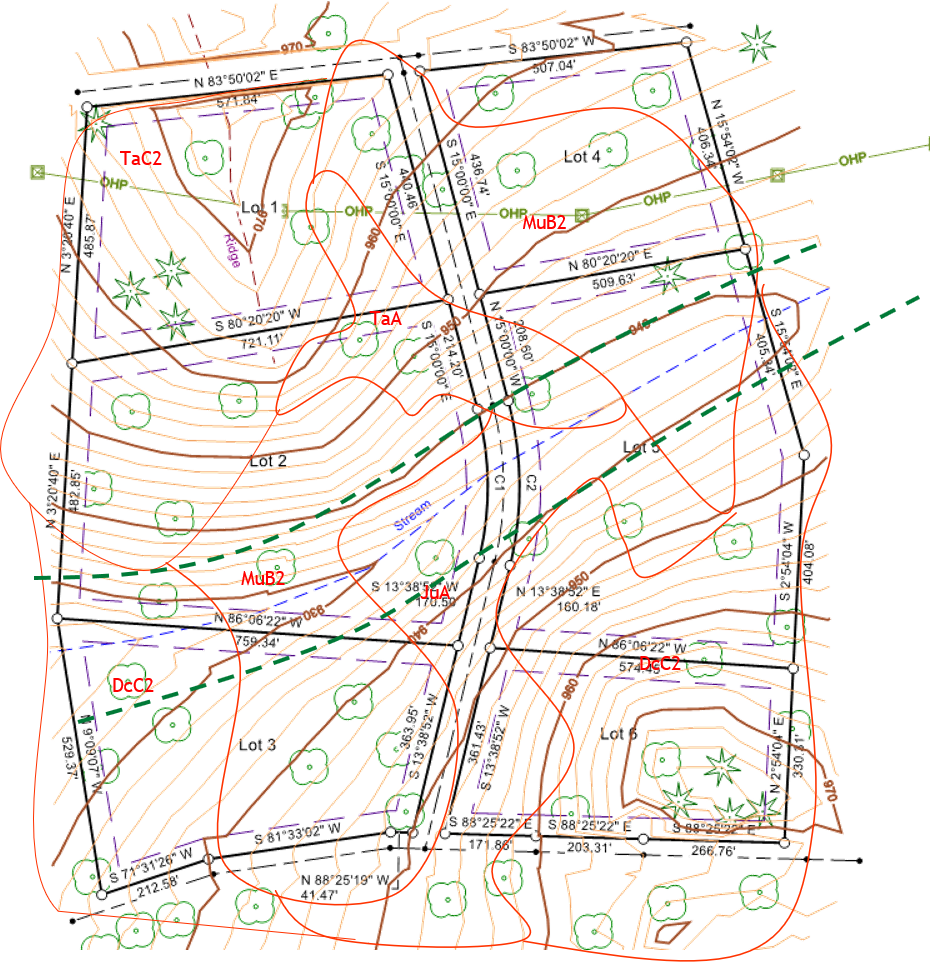 |
| Figure A-13 Too Much Information? |
It can be even worse. Back in the days of manual drafting, drawings were basically black and white, Figure A-14.
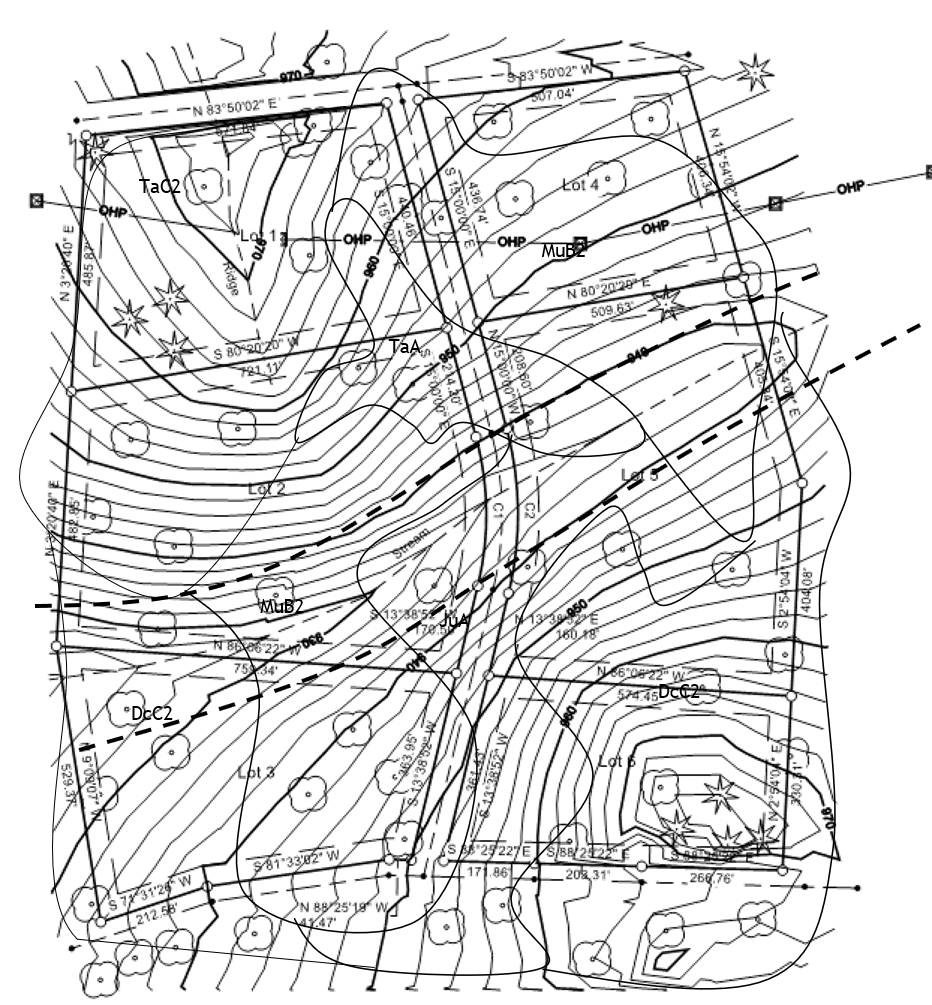 |
| Figure A-14 Map in Black and White |
Without color, the map becomes even harder to interpret. Contemporary digital mapping systems support colors and data management by layer or theme. A map can be produced which only displays that information required for the current need. However, because different quality data can be mixed in digital systems, accuracy is often overestimated.
Interpretation difficulty at best makes a map unsuitable or, at worse, cause costly mistakes. In the next chapter we will discus elements that should be included on a map to facilitate interpretation.