a. Metric/Non-metric Maps
(1) Metric
A metric map is one on which measurements can be made to support mathematical computations. An critical metric map attribute is scale which allows us to relate map measurements to their real world counterparts. We'll discuss scale in greater detail in a subsequent chapter.
(2) Non-metric
Non-metric maps convey information visually and not necessarily in a fashion that support accurate spatial measurements. Map emphasis is mostly interpretive showing trends, distribution, etc. Their information is often divided into classification groups and use colors, symbol types, and symbol sizes to provide a visual impression of the data.
Figure A-1 is an example of a non-metric map, compiled by National Public Radio (www.npr.org). It is a map of the United States with each state a colored hexagon. Hexagons are all the same size and their color shows Coronavirus case growth over the previous two weeks.
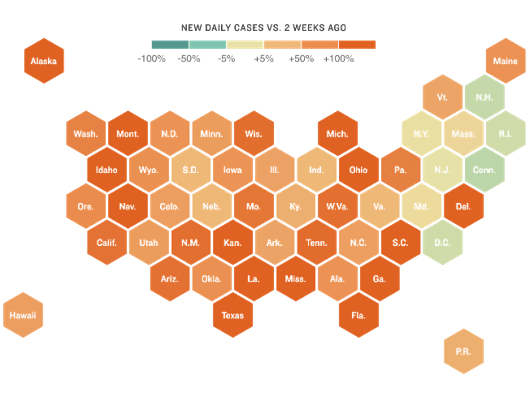 |
| Figure A-1 Coronavirus Case Growth, 20 Nov 2020 |
The map is roughly US-shaped; states are generally in correct relative positions. The map's emphasis is disease spread, not accurate spatial measurements. Everything else being the same, color allows quick data interpretation.
Another example of a non-metric map is one using graduated symbols to show major US cities population. Symbol sizes visually communicate different populations. Figure A-3 shows five different population values (center column) and two different symbol gradations schemes.
- Gradations on the left are proportional based on symbol radius, eg, Radius200K = 2x(Radius100K)
- Gradations in the right column are proportional based on symbol area, eg, Area200K = 2x(Area100K)
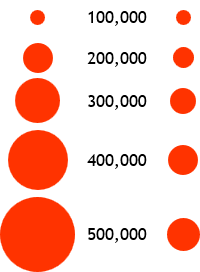 |
| Figure A-3 Symbol Gradation |
Comparing the symbol gradations:
- Radius-based sizes appear to increase at a rate greater than population increase causing over-estimation at higher populations.
- Area-based sizes appear to increase at a lower rate than population change. Upper increases are not discernible (compare 400,000 and 500,000). Cumulative effect is under-estimation at higher populations.
Neither geometric gradation looks "right". Cartographers use psychological scaling schemes which take into account how our minds perceive size gradations. Psychological scaling is also influenced by color and symbol type. A non-metric map with poor graphic choices can confuse instead of clarify.
(3) Quasi-metric
Quasi-metric maps share characteristics of metric and non-metric maps. Measurements can be made on a quasi-metric map, but there is an inherent uncertainty in feature depictions on the map. The feature location uncertainty is greater than the map compilation accuracy (which we'll look at in a bit).
An example of a quasi-metric map in surveying and engineering is a soil survey map, figure A-4.
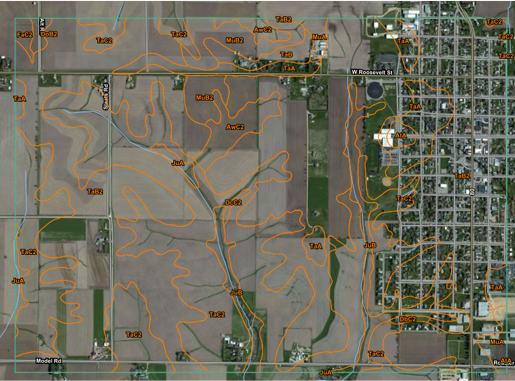 |
| Figure A-4 Soil Survey Map |
Although shown with lines, soil boundaries are not discrete; they are transitional areas between predominant soil types. In mapping parlance, these are called "fuzzy" boundaries. We can measure the area of a soil type polygon, but its certainty will be affected by the boundary fuzziness.
Other common examples of quasi-metric feature depiction include wetlands, ground cover, and forest canopy. Some fuzzy boundaries are transitional by nature, others can change over time.