3. Contemporary Datasheet
Along with the NSRS containing more control points than for NAD 27, it contains more types and information about them. Although the NSRS information is digitally stored and retrieved, the format is still referred to as a datasheet. A general format is still used but detailed content depends on the specific control point. Complete datasheet format is described in this document.
Datasheets can be retrieved at NGS's original Datasheet Retrieval page or via a graphic interface at its Data Explorer page . The are many different searching options and data can be downloaded in text or GIS shapefile formats. The datasheets are created on demand using the latest information in the digital database.
Sidebar
The Wisconsin State Cartographer's Office (SCO) has developed a graphic Survey Control Finder tool for locating survey control data in Wisconsin. Users can search for NSRS control as well as county networks and historic USGS data. Control Finder links to and extracts from corresponding databases so the most current data is displayed.
The original NAD 27 datasheet for a point generally consisted of a single page; contemporary sheets can continue for a quite a few pages. They contain explanatory notes, links to more information, possibly image links. Point Johnson's datasheet is just over three pages long and it's one of the shorter ones.
a. General Format
(1) Identification, Figure I-10
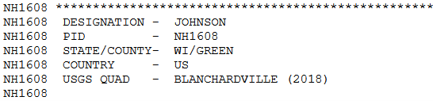 |
| Figure I-10 Identification |
Each point has a unique six character (two letters and four digits) Point Identifier (PID). It's not related to the NAD 27 point number identifier. When the datasheet is generated, each line begins with the PID.
Special point types will be identified in this area.
(2) Geodetic Information, Figure I-11
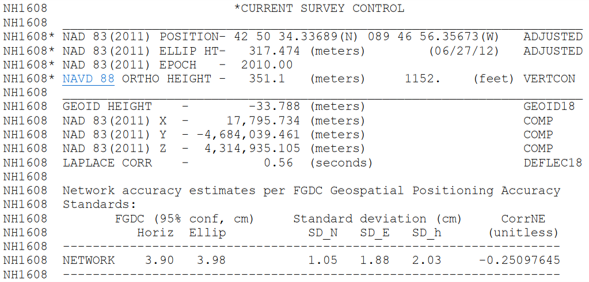 |
| Figure I-11 Geodetic Information |
Every point in the NSRS has horizontal and vertical coordinates, but that does not mean they are all 3D control points.
A horizontal control point will show geodetic coordinates to 5 decimal places on the seconds and say Adjusted at the end of the line.
A vertical control point will show Ortho Ht to 3 (meters) or 2 (feet) decimal places and say Adjusted at the end of the line.
Both will also identify the corresponding datum.
If the position is computed, it will show the product used or the process (e.g. "Scaled" from a map, measured with a handheld GPS, etc)
Geoid height and TCS coordinates are given. Adjustment statistics are shown if available.
Following this information will be additional information explaining how the positions were measured and/or determined..
(3) Grid Information, Figure I-12
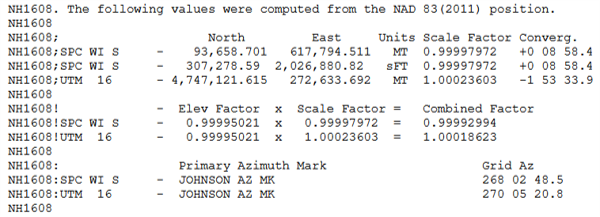 |
| Figure I-12 Grid Information |
SPC and USM grid coordinates, scale factor, and convergence.
Elevation factor (to convert ground to geoid distance) is shown as is the combined factor (ground to grid).
If an azimuth mark is present, the grid azimuth to it will be shown in SPC and UTM.
(4) Geodetic Directions
Traditional control points were connected to other points with combinations of angle and/or distance measurements. When the network was adjusted, geodetic directions would be included on the control point's datasheet. Figure I-13 is the information for point Johnson.
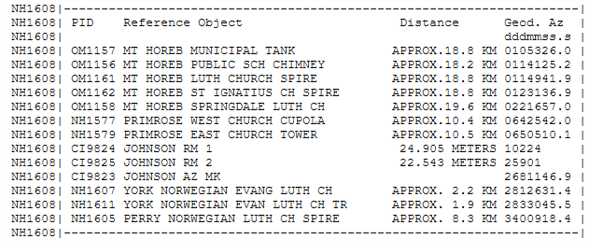 |
| Figure I-13 Geodetic Directions |
This information provides the surveyor direction orientation when using Johnson as a control point.
If the station has a paired azimuth mark, the geodetic azimuth to it will be shown. The difference between the geodetic azimuth in this section and the grid azimuth in the grid information system is the convergence angle. NGS does not account for the arc-to-chord correction between the control point and its azimuth mark.
Factoid: Geodetic directions are referenced to North however prior to NAD 83, C&GS/NGS referenced geodetic directions to South.
Contemporary points established by GPS generally do not include this information because GPS isn't connected to other points by direct measurements
(5) Superseded Control, Figure I-14
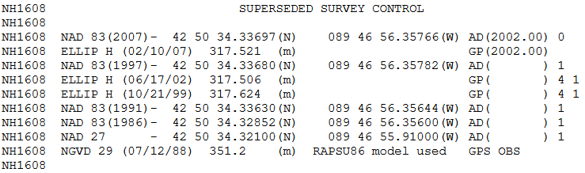 |
| Figure I-14 Superseded Control |
The point's historical horizontal and vertical positions are listed.
(6) Monument Information, Figure I-15
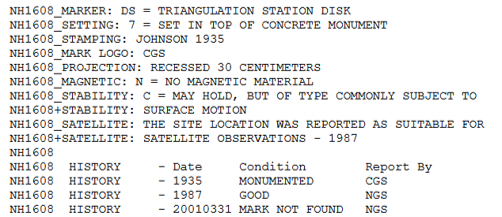 |
| Figure I-15 Monument Information |
This section gives a brief description of the point's physical feature and a short summary of its reported condition starting with original placement. This section can be quite lengthy depending on the number of condition reports filed.
(7) Station Description
This is a chronological narrative section describing:
How to reach the station
Location of the corner and its accessories
Observation conditions
The oldest description (listed first) of traditionally established points will include instrument and target heights to sighted points. Figure I-16 describes sighting conditions at point Johnson. which are a repeat of the same information on the old datasheet.
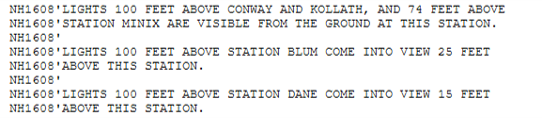 |
| Figure I-16 Instrument and Target Heights |
(8) Station Recovery
This is a narrative section which chronologically details condition reports and updates to the station description information.
b. Condition Reports
NGS has made it easier for users to submit control point condition reports. Condition is reported using the online form on the Survey Mark Recovery page. Images can be included as part of the recovery information. If the field situation differs from the last reported condition, or the database doesn't have images, file an update.