2. Other Elements
a. Labels
Labels are used on non-metric maps that indicate relative positioning, Figure B-11, or serve as indices to other information resources, Figure B-12.
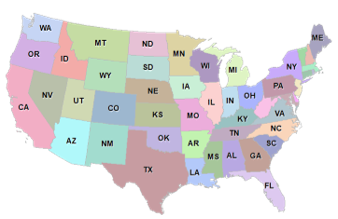 |
| Figure B-11 State Labels |
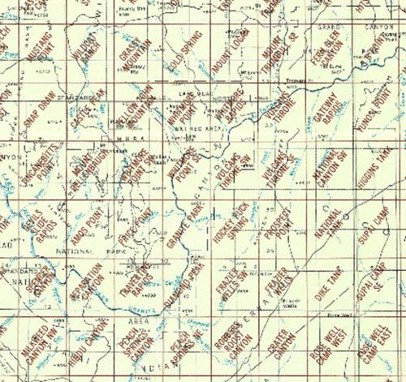 |
| Figure B-12 Topoquad Index Map |
Labels are also used on metric maps to identify features, dimensions, and other salient features.
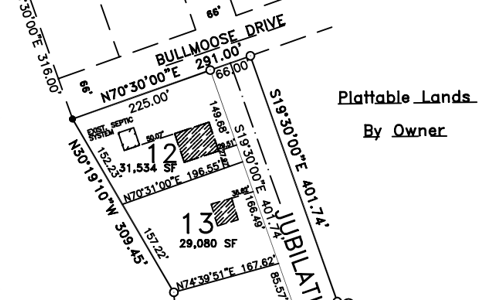 |
| Figure B-12 Metric Map Labels |
Labels on the legal map in Figure B-12 include:
- Parcel line lengths and directions
- Street names and widths
- Adjacent landowner reference
- Building locations
- Septic system identification
b. Spatial Reference Systems
If a formal horizontal coordinate system is used on a map, it should be identified. USGS topoquads usually have two or more coordinate systems and are identified as in Figure B-13.
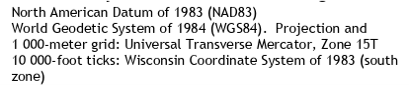 |
| Figure B-13 Topoquad Coordinate Reference |
The coordinate system reference should include its datum and units.
Similarly, if elevation information is shown on the map, the vertical system and units should be stated. Figure B-14 is typical for USGS topoquads.
| Figure B-14 Topoquad Vertical Reference |
Figure B-15 is from a WIDOT plans set.
|
Coordinates on this plan are referenced to the Wisconsin County |
| Figure B-15 From WIDOT Plan Set |
If coordinates or elevation are important map information, their reference should be stated, even if assumed, Figure B-16.
 |
| Figure B-16 Assumed System Reference |
c. Explanatory Notes
Explanatory notes are more detailed than labels. They can provide additional background information, Figure B-17.
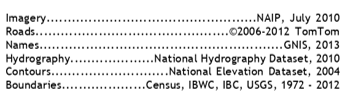 |
| Figure B-17 Data Sources |
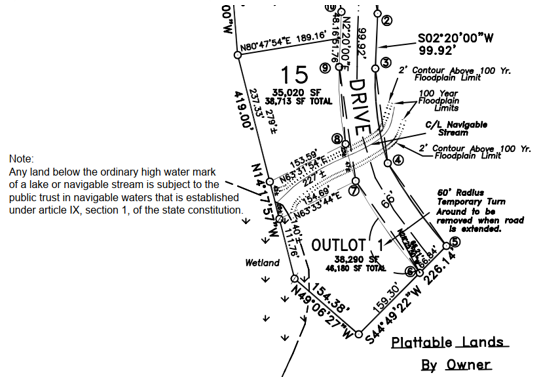
While graphic elements represent features, sometimes they are hard to see or are important enough to warrant some additional explanation. Figure B-18, from a legal map, uses a mix of labels and explanatory notes.
 |
| Figure B-18 Multiple Explanatory Notes |
d. Other Elements
A specialty can include other elements unique to that map or its purpose.
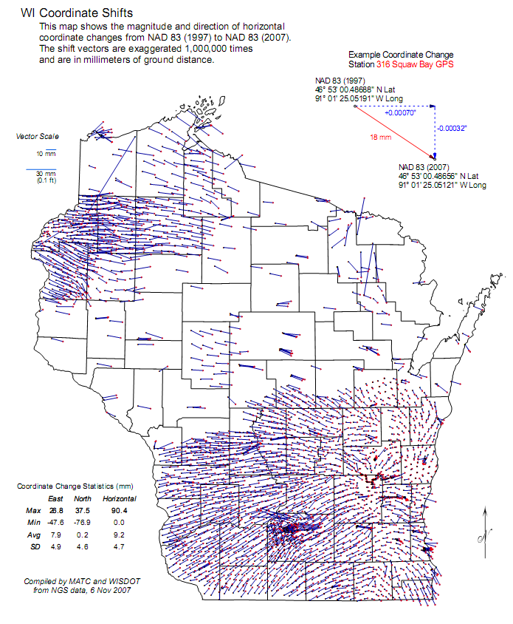
Figure B-19 is an example of a specialized map. When the North American Datum of 1983 (NAD 83) was readjusted from the 1997 version to 2007, control station horizontal positions changed. Position shifts were difficult to interpret from the NAD 83 (1997) and NAD 83 (2007) positions provided by the National Geodetic Survey (NGS) in text form.
To examine the readjustment effect in Wisconsin, the shift at each point was computed as a vector having direction and magnitude. These vectors were plotted on a Wisconsin counties map. Because shifts were small (<0.1 meters), vectors were exaggerated to be visible.
 |
| Figure B-19 Datum Readjustment Position Shifts |
The map has a mix of metric and quasi-metric information. Unique items on the map include:
- Statistical summary table
- Detail graphic of example vector
- Vector scale, graphic and relative
Mapping the shifts provided a visual indication of their behavior. It also helps identify outliers: a position shift magnitude and/or direction significantly different from surrounding points. Note the wayward shift in the northwestern part of the state - its vastly differnt magnitude and direction are obvious on the map, not so much in a table.
Depicting the information graphically makes patterns and problems much easier to see than the same data in text form. A map provides us another way to look at data.