2. Scale Expression on a Map
There are two ways to express scale on a map: Statement and Graphic.
a. Statement
A statement gives the map-to-ground proportion numerically. The statement can be one of two formats.
(1) Equivalence
An equivalence uses mixed map and ground units. In surveying and engineering the equivalence is always expressed in terms of 1 map unit = X ground units.
1 inch = 100 feet, 1"=500', etc
Architectural drawings generally express scale as X drawing units = 1 real unit.
3/8"=1'-0", 1/2"=1'-0", etc
Because units are included, a scale statement is either English or metric.
(2) Ratio
A ratio is dimensionless. It's expressed as 1 map unit: X ground units. The map and ground units are the same so they cancel. A ratio uses a colon (:) intead of an equals sign (=).
1:1000, 1:24,000, etc.
Because a ratio is dimensionless, it can be used with either the English or metric system.
1:1000 can be 1 ft = 1000 ft or 1 cm = 1000 cm
(3) Confusion?
Equivalence and ratio scales can cause confusion if not articulated correctly. It's not uncommon for someone to refer to a map's scale as "one to a hundered." Does the person mean 1 inch = 100 feet or 1:100? Are they the same?
Nope. They are different and we need to understand how to convert one to the other to avoid ambiguity.
To go from equivalence to ratio, convert the ground units to the map units.
What is 1 in = 300 ft as a ratio?
300 ft x (12 in / 1 ft) = 3600 in
1 in = 3600 in
Because map and ground units are the same, they cancel
1:3600
To go from ratio to equivalence, write the ratio with the same units on both sides. Then convert the ground side units to the ones desired.
What is 1:600 as a 1 in = X ft equivalence?
1:600 is the same as 1 in = 600 in
600 in x (1 ft / 12 in) = 50 ft
1 in = 50 ft
So, 1 in = 100 ft as an equivalence is 1:1200 which is not the same as 1:100.
b. Graphic
A graphic scale is a built-in ruler drawn on the map, Figure C-4.
| Figure C-4 Graphic Scale |
It serves the same purpose as a scale device except it can't be moved around the map.
Depending on map type or content, it may have multiple graphic scales. Figure C-5 are the graphic scales from a typical USGS 7-1/2 minute topoquad.
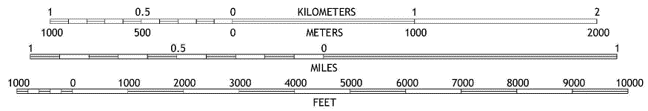 |
| Figure C-5 7-1/2' Topoquad Graphic Scales |
Including multiple graphic scales allows using different units (eg, Miles and Feet) and different systems (English and metric).
c. Combined
Most maps should contain both a scale statement and a graphic scale, Figure C-6. Why?
 |
| Figure C-6 Original Map Scale |
Let's say we have a paper map plotted at a scale of 1 inch = 200 feet. To see some additional detail, we use a copy machine enlarge the map by 1.5, Figure C-7.
 |
| Figure C-7 Enlarged Map |
At the enlarged size, the scale statement still says 1 inch = 200 feet which is no longer correct. But the graphic scale is correct because it enlarged the same amount.
A graphic scale will always be correct regardless the map's plotted size. A scale statement, however, is only correct at the original compilation scale.
By the way, what's the correct scale statement for the enlarged map in Figure C-7?