2. Application
Instruments using stadia can be divided into two categories:
- Fixed horizontal telescope
- Telescope that rotates in vertical plane
a. Fixed horizontal telescope
This category is made up of levels: Dumpy, Wye, and automatic.
A vertical rod will be perpendicular to the center LoS. The top and bottom LoSs should intersect the rod the same distance (half-interval) above and below the center LoS. This helps isolate reading errors. For example, the top, middle, and bottom readings in Figure D-3 are 7.66, 7.32, and 6.98. The top half-interval is (7.66-7.32)=0.34, the bottom half-interval is (7.32-6.98)=0.34. The average of the three readings is (7.66+7.32+6.98)/3 = 21.96/3 = 7.32. The half-intervals and average may differ sightly because of random reading errors, but any large differnce means there is a mistake.
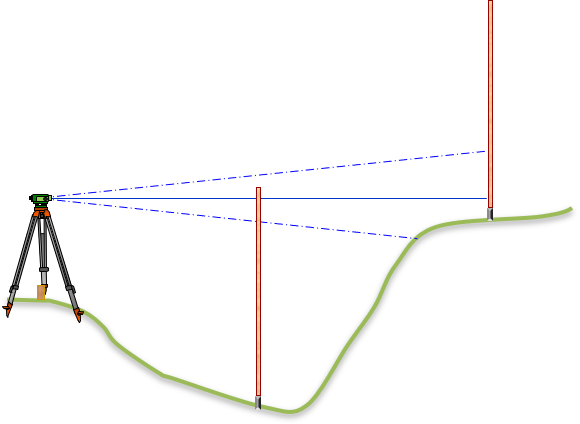
Because their telescopes are limited to horizontal, stadia with levels is limited over rolling terrain. In Figure D-5, all three LoSs do not intersect the rod if the point sighted is too low or too high.
 |
| Figure D-5 Level Stadia Limitations |
Technically, in both cases of Figure D-5, the half-interval can be determined using the two cross hairs that intersect the rod. These half-intervals can be doubled then multiplied by the stadia multiplier to compute the horizontal distances. The drawbacks are: (1) any error in the half-interval is doubled (2) reading mistakes can't be trapped.
Stadia with levels is generally limited to (1) balancing backsight and foresight distances and (2) measuring distances to use for proportional level circuit adjustment. These are both more fully discussed in the IV. Elevations topic.
b. Telescope that rotates in vertical plane.
(1) Geometry
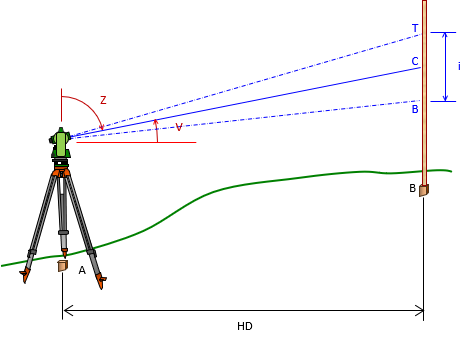
Instruments in this category are alidades, transits, theodolites, and total stations. A rotating telescope provides greater flexibility allowing distance measurement along sloped surfaces, Figure D-4. Equation D-1 results in a slope distance with an inclined or depressed telescope. To reduce slope to horizontal requires measurement of the vertical or zenith angle and Equation D-1 modified to Equation D-2 or D-3.
 |
| Figure D-4 Rotated Telescope |
 |
Equation D-2 |
 |
Equation D-3 |
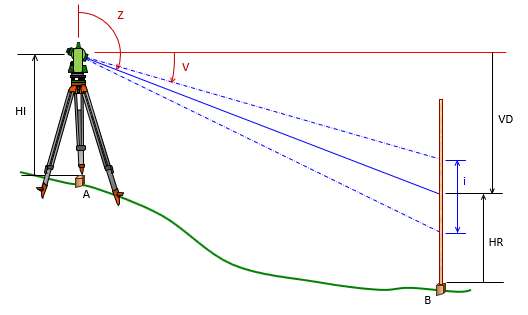
Another advantage of a rotating telescope is the ability to determine vertical distances to points substantially above or below the horizontal center LoS of a level. This allows elevation determination by trigonometric methods. Figure D-5 and Equations D-4 through D-6.
 |
| Figure D-5 Elevation Determination |
 |
Equation D-4 |
 |
Equation D-5 |
 |
Equation D-6 |
HI and HR in Equation D-6 are the instrument height and center cross hair reading on the rod, respectively. Sighting the HI on the rod simplifies Equation D-6 since HI and HR cancel.
On inclined or depressed sights, the center LoS is not perpendicular to the rod and is not in the center of the rod interval. In Figure D-4, the top half-interval is larger than the bottom half-interval, in Figure D-5 that is reversed. The greater the inclination or depression, the greater the difference between half-intervals. The difference should be relatively small, a large difference is still an indication of a possible reading mistake.
(2) Alidade
Much of the early US topographic mapping was accomplished with alidades on plane tables and later with transits, all based on stadia principles.
An alidade is a telescope with an abbreviated vertical circle (Beaman arc) mounted to a graduated straightedge parallel with the vertical plane of the telescope, Figure D-6.
|
|
| Figure D-6 Alidade |
The alidade sat on a plane table which was basically a drafting table mounted to a tripod and oriented over a point. A sheet of paper was mounted on the plane table, Figure D-7.
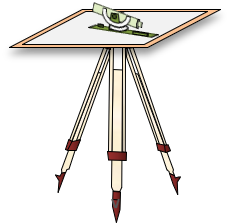 |
| Figure D-7 Alidade and Plane Table |
The Beaman arc is a special version of a vertical circle with logarithmic scales allowing faster stadia computations in the field without reverting to trig tables (this was waaaay before calculators and smart phones). Figure D-8 shows examples of two different Beaman arcs.
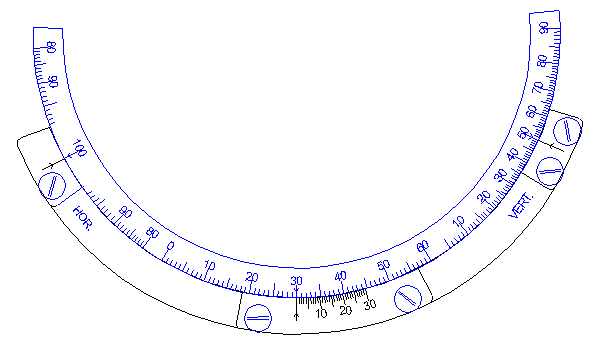 |
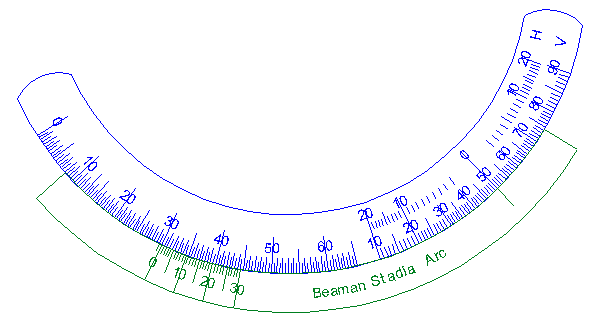 |
| Figure D-8 Beaman Arc Examples |
Stadia readings were made to a stadia board held on a point. Once the distance was computed, the point would be plotted on the paper using the alidade's scale. In this way, the initial draft of a map was compiled directly in the field.
A stadia board, Figure D-9, is simply a wider level rod with distinct division markings making readings easier at long distances.
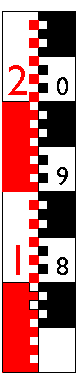 |
| Figure D-9 Stadia Board Portion |
(3) Self-reducing tacheometry
A major difference between transits and theodolites is the latter uses glass horizontal and vertical circles in the place of metal ones. The angle reading system is optical, using light internal to the instrument to project the circle readings to an auxillary eyepiece. Prior to the advent of total stations, a few manufactures developed a special theodolite model called a self-reducing tacheometer. These used a secondary glass circle on which were curves lines. One set of lines was plotted according to horizontal stadia distance reduction, the other according to vertical stadia distance reduction. These where projected into the field of view in place of fixed stadia crosshairs.
Figure D-10 is the view through the eyepiece of a self-reducing tacheometer. The center crosshair is actually below the center of the view. The top stadia hair has a 100 multiplier for the difference between it and the center hair rod readings; the bottom has a 200 multiplier. The numbered diagonal lines are multipliers for elevation differences (the numbers appear in the field of view)
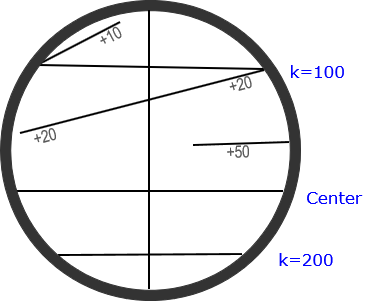 |
| Figure D-10 Self Reducing Tacheometer View |
As the telescope is inclined or depressed, the spacing between the stadia hairs changes and different vertical reduction lines move across the field of view.
The 0 reading on the stadia board is 4 to 5 feet above the bottom. Numbering increases above and below it, Figure D-11.
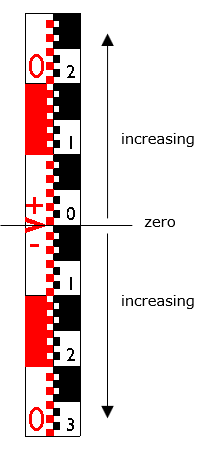 |
| Figure D-11 Stadia Board |
The board generally has an extension foot that allows adjusting the 0 mark to the instrument's height. When sighting, the center crosshair is placed on the 0 mark which makes makes interval calculation simple. Figure D-12 shows a stadia board sighting.
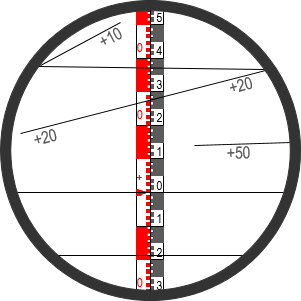 |
| Figure D-12 Example Reading |
To determine the horizontal distance:
Top hair reading is 0.37; distance is 0.37x100 = 37.0
Bottom hair reading is 0.19; distance is 0.19x200 = 38.0
The bottom reading serves as a check or can be used if the top stadia hair is above the rod.
To determine elevation
+20 line crosses at reading 0.28; vertical distance is 0.28x(+20) = +5.6
Because the 0 mark is at the instrument height, the elevation is the point elevation at the instrument plus the vertical distance.
A self-reducing tacheometer could be considered the optical equivalent of an alidade. As a matter of fact, at least one manufacturer developed a special circular table on which the tacheometer was mounted. Figure D-13 is my very rough rendition of one such table.
 |
| Figure D-13 Tacheometer with Table |
The center of the circular map sheet was the instrument location. As the tacheometer was rotated horizontally, the table was geared to rotate also, keeping the map oriented correctly. A scale was attached to a rail parallel with the telescope. When the distance was determined, a marker would be slid along the rail to the scaled distance and a mark made on the map. An interesting device, but it was very quickly bypassed by development of digital measuring methods.