{KomentoDisable}
I. Control Data
A. Introduction
In the XII. Datums topic we saw that the national network grew from ~27,000 horizontal control points in NAD 27 to over 270,000 for NAD 83. In the 35+ years since, the National Spacial Reference System (NSRS) has grown to over 680,000 horizontal, vertical, and combined control points. The NGS maintains an internet accessible digital database of control information. Users are able to locate control points by name, location, proximity, rectangular area, or topoquad.
This chapter is a very basic description of the general data content for control point retrieval. Due to point type diversity, measurement technologies, multiple readjustments, etc,. specific data will vary point to point.
B. Historical Background
Prior to the NAD 83 readjustment C&GS (now NGS) maintained records in written form. Control information was conveyed to users in paper form called datasheets using a simple standardized format.
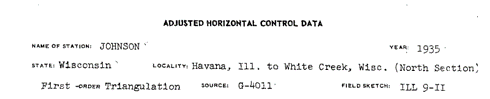
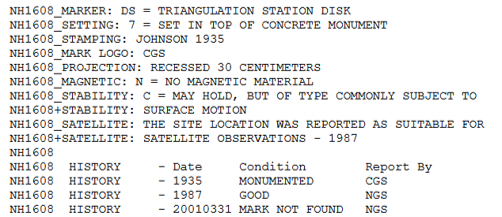
Figure I-1 is the datasheet for control point Johnson; click here for a pdf version
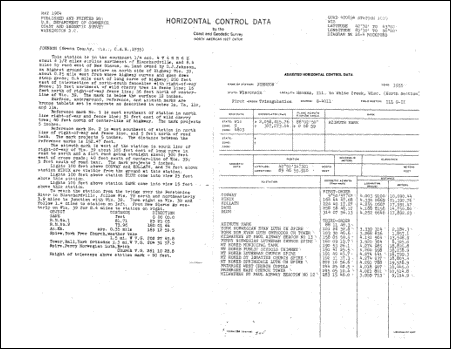 |
| Figure I-1 Johnson Datasheet |
Most control points had a single one-sided datasheet. Because they were not occupied, two third-order intersection stations were commonly included together on a single datasheet sude.
1. Identification
The top of the datasheet identifies the datum, Figure I-2, and point identification, Figure I-3.
 |
 |
| Figure I-2 Datum |
Figure I-3 Point Identifier |
Each point is uniquely is identified by a quadrangle index and number.
QUAD
The quadrangle is 30-minute by 30-minute area identified by its southeastern corner. Digits one and two are the latitude degrees, digits three through five are the longitude degrees. The sixth digit is a quadrant: 1-NE, 2-SE, 3-SW, 4-NW. Figure I-4 is an explanatory note on a Wisconsin State Triangulation Index map.STATION
Figure I-4
Note on State Triangulation Index Map
The station number is a sequential number, beginning with 1001, within the quad.Additional information
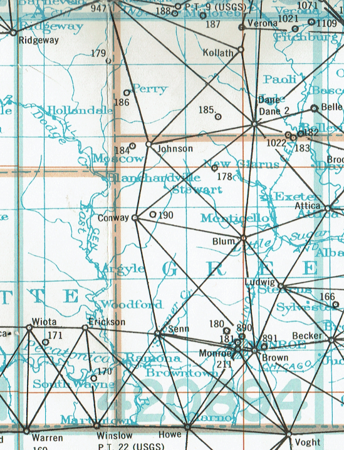
LATITUDE and LONGITUDE are the extent of the quadrangle.Johnson is point number 1015 in the NW quadrant of the 42°30-43°00' x 89°30'-90°00', Figure I-5.
DIAGRAM is the 2-degree by 1-degree USGS topoquad.
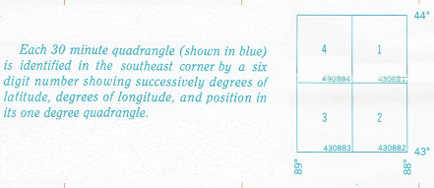
Figure I-5
Quad 4 of Quadrangle 42089
2. Location and Monument
The left side of the datasheet, Figure I-6, describes the point's general location, monumentation, and accessory information.
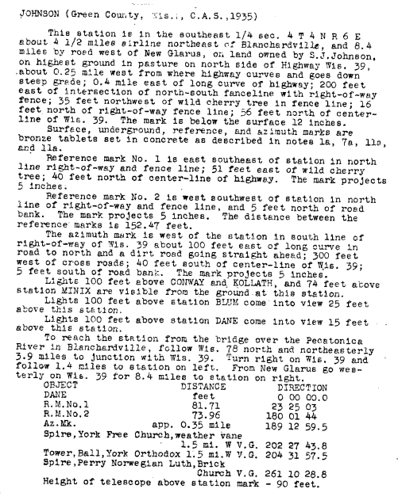 |
| Figure I-6 Monument and Location |
It may also include observation condition information.
Yup, the targets were set 100 ft above some points and the instrument (and operator) was 25 feet above Johnson.
Historical Note
In order to sight long distances and see above obstructions, instrument and target towers were often used. Various non-standard wooden and metal towers were used until 1926 when Jasper Bibly introduced his namesake steel towers. They were sturdy and designed for transportation, erection, use, and teardown efficiency so were quickly adopted for geodetic surveying. The NGS Historical Photo Archives has some great images of towers and the surveyors brave enough to scale them. If you think centering a total station ~5.5 ft above a ground mark can be a challenge, consider centering a theodolite 100+ ft above a ground mark..
3. Position Information
The right side of the datasheet contains specific position information and connections to other control points.
a. Network information, Figure I-7
 |
| Figure I-7 Network Information |
Johnson is a first order triangulation station established in 1935.
b. Grid information, Figure I-8
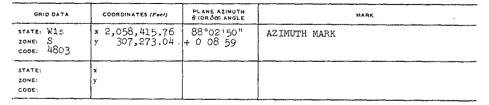 |
| Figure I-8 Grid Information |
Multiple coordinates could be shown if the point was near the edge of a zone.
For point Johnson: Wisconsin South SPC zone
Coordinates
Convergence
Grid azimuth to the azimuth mark
c. Geodetic information, Figure I-9
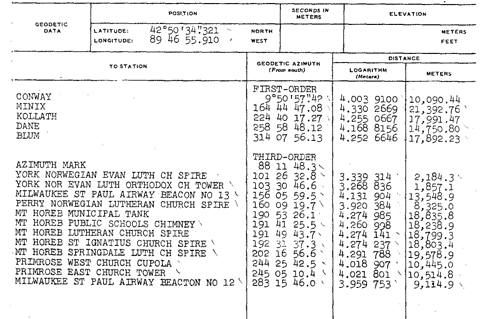 |
| Figure I-9 Geodetic Information |
Geodetic coordinates, elevation (if available), and azimuths and directions to other control points observed. Not all control points will have this latter information.
Because Johnson was part of a first order triangulation network, it includes observations to other network points as well as other visible points.
C. Contemporary Datasheet
Along with the NSRS containing more control points than for NAD 27, it contains more types and information about them. Although the NSRS information is digitally stored and retrieved, the format is still referred to as a datasheet. A general format is still used but detailed content depends on the specific control point. Complete datasheet format is described in this document.
Datasheets can be retrieved at NGS's original Datasheet Retrieval page or via a graphic interface at its Data Explorer page . The are many different searching options and data can be downloaded in text or GIS shapefile formats. The datasheets are created on demand using the latest information in the digital database.
Sidebar
The Wisconsin State Cartographer's Office (SCO) has developed a graphic Survey Control Finder tool for locating survey control data in Wisconsin. Users can search for NSRS control as well as county networks and historic USGS data. Control Finder links to and extracts from corresponding databases so the most current data is displayed.
The original NAD 27 datasheet for a point generally consisted of a single page; contemporary sheets can continue for a quite a few pages. They contain explanatory notes, links to more information, possibly image links. Point Johnson's datasheet is just over three pages long and it's one of the shorter ones.
1. General Format
a. Identification, Figure I-10
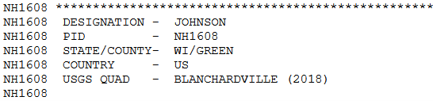 |
| Figure I-10 Identification |
Each point has a unique six character (two letters and four digits) Point Identifier (PID). It's not related to the NAD 27 point number identifier. When the datasheet is generated, each line begins with the PID.
Special point types will be identified in this area.
b. Geodetic Information, Figure I-11
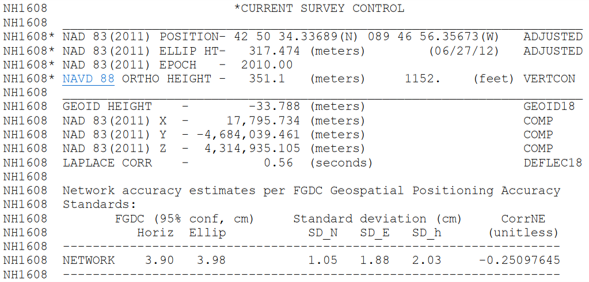 |
| Figure I-11 Geodetic Information |
Every point in the NSRS has horizontal and vertical coordinates, but that does not mean they are all 3D control points.
A horizontal control point will show geodetic coordinates to 5 decimal places on the seconds and say Adjusted at the end of the line.
A vertical control point will show Ortho Ht to 3 (meters) or 2 (feet) decimal places and say Adjusted at the end of the line.
Both will also identify the corresponding datum.
If the position is computed, it will show the product used or the process (e.g. "Scaled" from a map, measured with a handheld GPS, etc)
Geoid height and TCS coordinates are given. Adjustment statistics are shown if available.
Following this information will be additional information explaining how the positions were measured and/or determined..
c. Grid Information, Figure I-12
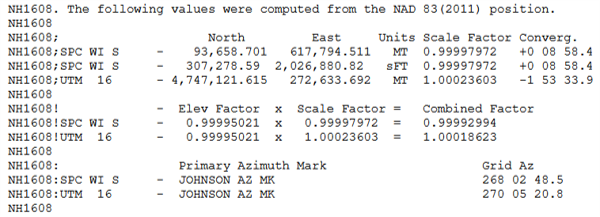 |
| Figure I-12 Grid Information |
SPC and USM grid coordinates, scale factor, and convergence.
Elevation factor (to convert ground to geoid distance) is shown as is the combined factor (ground to grid).
If an azimuth mark is present, the grid azimuth to it will be shown in SPC and UTM.
d. Geodetic Directions
Traditional control points were connected to other points with combinations of angle and/or distance measurements. When the network was adjusted, geodetic directions would be included on the control point's datasheet. Figure I-13 is the information for point Johnson.
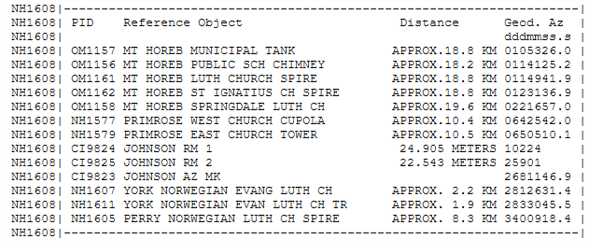 |
| Figure I-13 Geodetic Directions |
This information provides the surveyor direction orientation when using Johnson as a control point.
If the station has a paired azimuth mark, the geodetic azimuth to it will be shown. The difference between the geodetic azimuth in this section and the grid azimuth in the grid information system is the convergence angle. NGS does not account for the arc-to-chord correction between the control point and its azimuth mark.
Factoid: Geodetic directions are referenced to North however prior to NAD 83, C&GS/NGS referenced geodetic directions to South.
Contemporary points established by GPS generally do not include this information because GPS isn't connected to other points by direct measurements
e. Superseded Control, Figure I-14
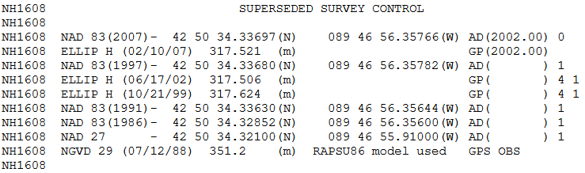 |
| Figure I-14 Superseded Control |
The point's historical horizontal and vertical positions are listed.
e. Monument Information, Figure I-15
 |
| Figure I-15 Monument Information |
This section gives a brief description of the point's physical feature and a short summary of its reported condition starting with original placement. This section can be quite lengthy depending on the number of condition reports filed.
f. Station Description
This is a chronological narrative section describing:
How to reach the station
Location of the corner and its accessories
Observation conditions
The oldest description (listed first) of traditionally established points will include instrument and target heights to sighted points. Figure I-16 describes sighting conditions at point Johnson. which are a repeat of the same information on the old datasheet.
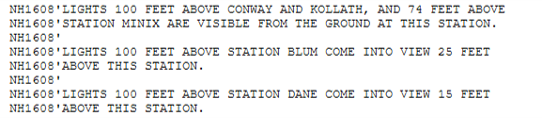 |
| Figure I-16 Instrument and Target Heights |
g. Station Recovery
This is a narrative section which chronologically details condition reports and updates to the station description information.
2. Condition Reports
NGS has made it easier for users to submit control point condition reports. Condition is reported using the online form on the Survey Mark Recovery page. Images can be included as part of the recovery information. If the field situation differs from the last reported condition, or the database doesn't have images, file an update.
D. Datum Realizations
Chapter D. The North American Datum of Topic XII discussed the NAD evolution. Control positions have been readjusted multiple times since NAD 83 was adopted. While the original NAD 83 (1986) realization included all existing control measurements, subsequent readjustments shifted toward only including control points with contemporary measurements. This was done to maintain reference network accuracy: combining early 20th century transit & tape measurements with current GPS observations would be detrimental to network integrity. Additionally, many older points were either lost or are inaccessible or in non-favorable locations so their positions were not subsequently updated.
Points which were historically part of the national control network are still included in the NSRS. Users should pay attention to the datum realization information on a datasheet. While NAD 83 (2011) is the most current datum realization - most traditional horizontal control points may only be included up to NAD 83 (1997).
The CURRENT SURVEY CONTROL datasheet section identifies the last realization in which the point was adjusted. Figure I-16 shows the current position information for two control points: Merrill GPS Az Mk and Voigt.
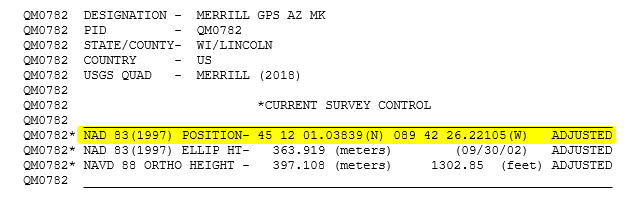 |
| (a) Point Merrill GPS Az Mk |
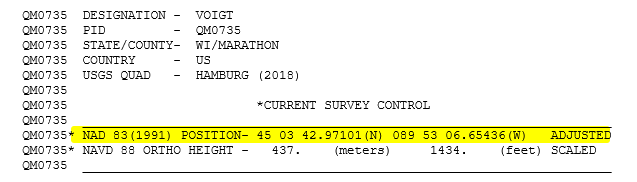 |
| (b) Point Voigt |
| Figure I-16 Current Control Data |
Although they are within a few miles of each other, their current positions are not on the same datum realization.
The SUPERSEDED SURVEY CONTROL datasheet section shows a point's position in previous realizations. If Voigt and Merrill GPS Az Mk will be used together, the latter's NAD 83 (1991) position must be used, Figure I-17.
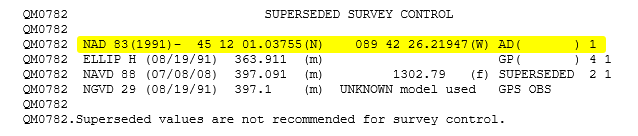 |
| Figure I-17 Point Merrill GPS Az Mk's Previous Positions |
Although position differences between realizations may be small, they can be significant. At Merriill GPS Az Mk, NAD 83 (1991) to NAD 83 (1997) latitude and longitude shifts are +0.00084" and +0.00158", respectively. That may not seem like much, but they are approximately 0.08 ft east and 0.16 ft north, which will affect survey closure.
When using multiple control points for a project, it is critical they be on the same datum realization and, unless necessary for historical purposes, on the most recent one.