{KomentoDisable}
C. Scale
The previous chapter briefly identified scale as an important map component. This chapter cover the topic a bit deeper discussing scale from map compilation and map use perspectives.
1. What is Scale?
Scale has two meanings in the context of precision drawings, including maps.
a. Map-Ground Relationship
Scale is the dimensional proportion of an object's representation and the object's size.
In Figure C-1, one inch on the map is 200 feet on the ground.
 |
| Figure C-1 Scale: Proportion |
b. Measuring Device
(1) General
A scale is device with a series of evenly ordered marks that is used to measure drawing objects. In its most basic form, called a ruler, it usually has inches and fractions thereof along an edge, with possibly a second set of divisions in centimeters and millemeters along another.
In surveying and engineering we call the device a scale. It can have one or more differently spaced division series along its edges. The scale in Figure C-2 has two sets of marks: 10 divisions per inch and 20 division per inch. These are referred to as the 10-scale and 20-scale.
 |
| Figure C-2 Scale: Measuring Device |
Multiple division sets allow direct measurement on map with a matching numeric scale. Because the scale of the map in Figure C-3 is 1"=200', the 20-scale is used to make measurements.
 |
| Figure C-3 Scaling Distances |
Using an appropriate scale allows distances to be plotted or measured without having to perform calculations.
2. Scale Expression on a Map
There are two ways to express scale on a map: Statement and Graphic.
a. Statement
A statement gives the map-to-ground proportion numerically. The statement can be one of two formats.
(1) Equivalence
An equivalence uses mixed map and ground units. In surveying and engineering the equivalence is always expressed in terms of 1 map unit = X ground units.
1 inch = 100 feet, 1"=500', etc
Architectural drawings generally express scale as X drawing units = 1 real unit.
3/8"=1'-0", 1/2"=1'-0", etc
Because units are included, a scale statement is either English or metric.
(2) Ratio
A ratio is dimensionless. It's expressed as 1 map unit: X ground units. The map and ground units are the same so they cancel. A ratio uses a colon (:) intead of an equals sign (=).
1:1000, 1:24,000, etc.
Because a ratio is dimensionless, it can be used with either the English or metric system.
1:1000 can be 1 ft = 1000 ft or 1 cm = 1000 cm
(3) Confusion?
Equivalence and ratio scales can cause confusion if not articulated correctly. It's not uncommon for someone to refer to a map's scale as "one to a hundered." Does the person mean 1 inch = 100 feet or 1:100? Are they the same?
Nope. They are different and we need to understand how to convert one to the other to avoid ambiguity.
To go from equivalence to ratio, convert the ground units to the map units.
What is 1 in = 300 ft as a ratio?
300 ft x (12 in / 1 ft) = 3600 in
1 in = 3600 in
Because map and ground units are the same, they cancel
1:3600
To go from ratio to equivalence, write the ratio with the same units on both sides. Then convert the ground side units to the ones desired.
What is 1:600 as a 1 in = X ft equivalence?
1:600 is the same as 1 in = 600 in
600 in x (1 ft / 12 in) = 50 ft
1 in = 50 ft
So, 1 in = 100 ft as an equivalence is 1:1200 which is not the same as 1:100.
b. Graphic
A graphic scale is a built-in ruler drawn on the map, Figure C-4.
| Figure C-4 Graphic Scale |
It serves the same purpose as a scale device except it can't be moved around the map.
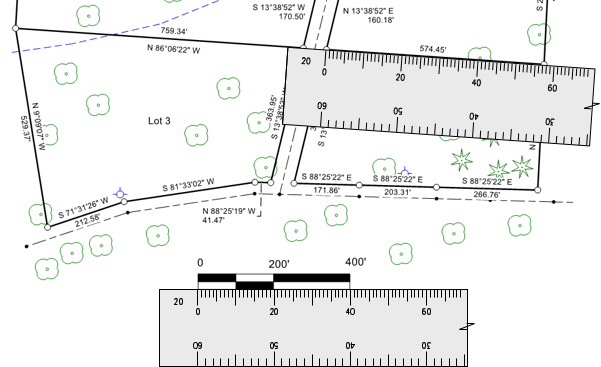
Depending on map type or content, it may have multiple graphic scales. Figure C-5 are the graphic scales from a typical USGS 7-1/2 minute topoquad.
 |
| Figure C-5 7-1/2' Topoquad Graphic Scales |
Including multiple graphic scales allows using different units (eg, Miles and Feet) and different systems (English and metric).
c. Combined
Most maps should contain both a scale statement and a graphic scale, Figure C-6. Why?
 |
| Figure C-6 Original Map Scale |
Let's say we have a paper map plotted at a scale of 1 inch = 200 feet. To see some additional detail, we use a copy machine enlarge the map by 1.5, Figure C-7.
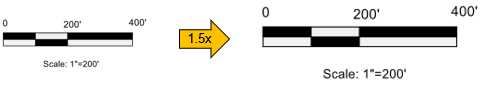 |
| Figure C-7 Enlarged Map |
At the enlarged size, the scale statement still says 1 inch = 200 feet which is no longer correct. But the graphic scale is correct because it enlarged the same amount.
A graphic scale will always be correct regardless the map's plotted size. A scale statement, however, is only correct at the original compilation scale.
By the way, what's the correct scale statement for the enlarged map in Figure C-7?
3. Large- vs Small-Scale
a. Which is Which?
Which is the larger scale, 1 in = 100 ft or 1 in = 200 ft? Most people would say 1 in = 200 ft is the larger scale because 200 is greater than 100. That's exactly the wrong logic.
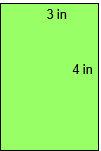
Large and small are distinguished by the drawing size of an object. For example, what size would a 400 ft x 300 ft parcel be on 1 in = 100 ft and 1 in = 200 ft maps?
1 in = 100 ft map
L = 400 ft x (1 in / 100 ft) = 4 in
W = 300 ft x (1 in / 100 ft) = 3 in
1 in = 200 ft map
L = 400 ft x (1 in / 200 ft) = 2 in
W = 300 ft x (1 in / 200 ft) = 1.5 in
The two map representations are shown in Figure C-9.
 |
 |
| 1 in = 100 ft | 1 in = 200 ft |
| Figure C-8 Scale Comparison |
|
The parcel plots larger at 1 in = 100 ft than at 1 in = 200 ft. That means 1 in = 100 ft is the larger scale.
b. Relative Terms
Large scale and small scale are relative terms for comparing one scale to another. There is no formal division between the two; it mostly depends on perspective.
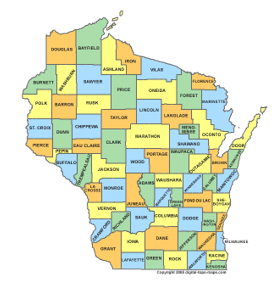
Compare the three maps in Figures C-9 and C-10.
 |
 |
| (a) Wisconsin | (b) Grant County |
| Figure C-9 State and County |
|
Figure C-9(b) map is a larger scale than Figure C-9(a) map.
|
 |
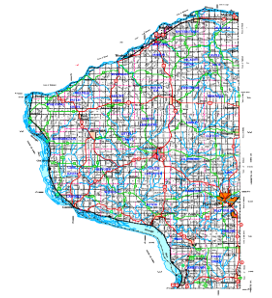
| (a) Grant County | (b) City of Platteville |
| Figure C-10 County and City |
|
Figure C-10(b) map is a larger scale than Figure C-10(a) map.
In one case, the Grant County map is the larger scale, in the other it is the smaller scale. Going further: a subdivision plat within Platteville would be a larger scale than the Figure C-10(b).
4. Engineer's Scale
A traditional Engineer's scale is six-sided, Figure C-11, with a division scale on each side.
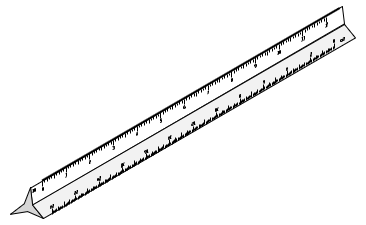 |
| Figure C-11 Engineer's Scale |
The scales are 10, 20, 30, 40, 50, and 60 divisions per inch. Each scale can be used to represent a number of different map scales.
For example, the 10 scale can be used as 1 in = 1 ft, 1 in = 10 ft, 1 in = 100 ft, etc.
It can also be used for ratio scales, 1:1, 1:10, 1:100, etc.
Traditionally, maps use a nominal scale based on 10-20-30-40-50-60 to allow direct measurement without converting. This is less prevalent in digital mapping, but still a consideration when plotting a digital map.
5. Scale Effect
Scale affects map generalization and resolution.
a. Generalization
Generalization has to do with how much data is necessary to depict features.
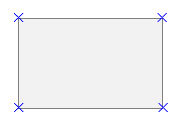
On a small scale map, a rectangular building location may be identified by a symbol plotted at single data point, Figure C-12(a). On a large scale map, four data points might be used to plot the building, Figure C-12(b).
 |
|
| (a) Small scale | (b) Large scale |
| Figure C-12 Data at Different Scales |
|
The large scale map has a greater data density than the small scale map.
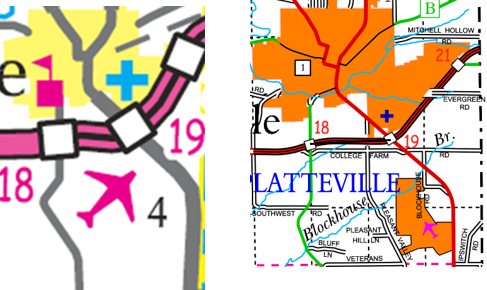
Figure C-13 are portions of two different maps of the Platteville area. They are shown in their correct relative size based on their compilation scale.
 |
|
| (a) State Highway Map 1:800,000 |
(b) County Map 1:100,000 |
| Figure C-13 Platteville Area at Two Scales |
|
Figure C-14 shows the small scale State Highway map enlarged to the same scale as the County map.
 |
| Figure C-14 Platteville Area at Same Scale |
The generalization effect at of the enlarged map is immediately apparent. There are fewer features since many of them are not visible at 1:800,000. The features that are shown lack the detail of the same features on the 1:100,000 map. Magnifying the Highway map magnifies symbol dimensions. It also magnifies errors.
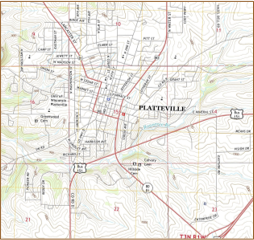
Figure C-15 is the same area from a 1:24,000 topoquad (because it's so much larger in relation to Figure C-13, it is shown at 75%)..
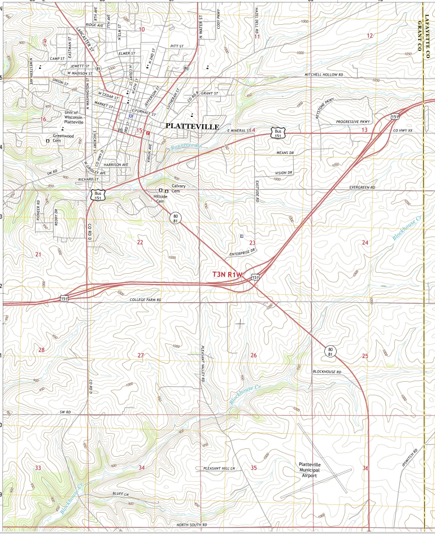 |
| Figure C-15 Platteville Area from 1:24,000 topoquad |
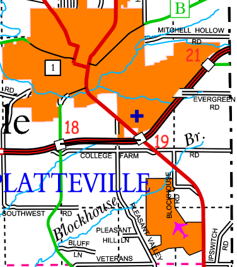
Figure C-16 is the 1:100,000 County Highway map from Figure C-12(b) enlarged to the scale of Figure C-15.
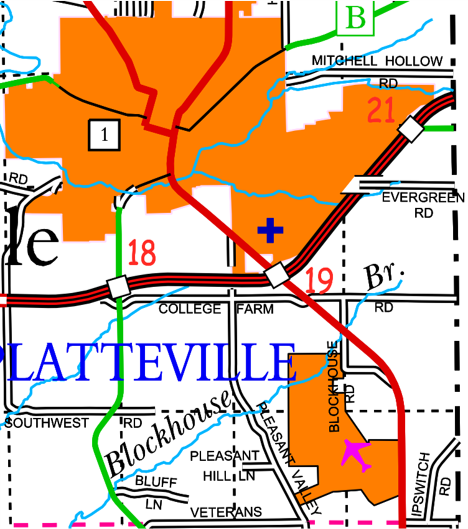 |
| Figure C-16 Platteville Area 1:100,000 Map Enlarged to 1:24,000 |
As before, the small scale map exhibits generalization when magnified to a larger scale.
Notice the progression:
1:800,000 is generalized compared to 1:100,000 which in turn is generalized compared to 1:24,000
Why not just collect data at the 1:24,000 density and use it to create the 1:800,000 map?
Cost. That's a lot of data to collect and mange to create the small scale map.
Generalization is tied to the scale which in turn is tied to user need.
b. Resolution
Think of map resolution as how accurately features are depicted. Resolution affects map use two ways:
- Extracting information from the map
- How map data is collected
The second effect will be discussed in a later chapter on topographic mapping.
For now, we'll concentrate om the first: using the map.
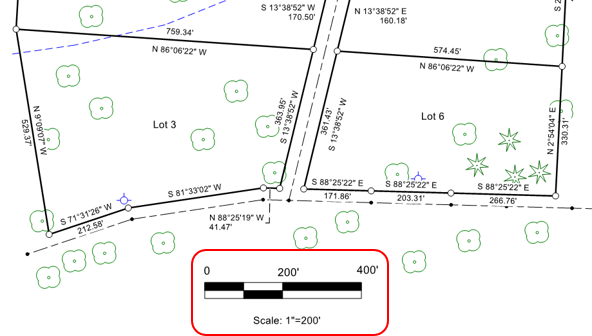
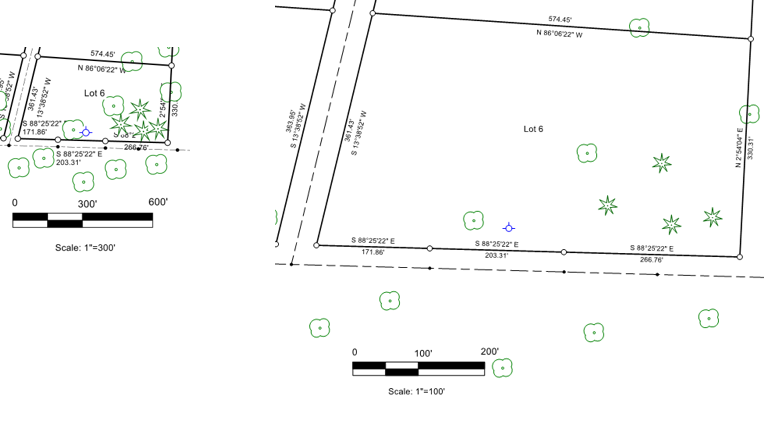
A paper map has built-in accuracy limitation: the measuring device. The map in Figure C-17 is plotted at 1 in = 200 ft.The distance between the northwest and southeast corners of Lot 6 is measured using a 20-scale. Each division on the scale is 10 feet; a distance can be realistically determined to the nearest half-division on the scale. In addition to half-division estimation, scale must be centered on the symbols at both corners. At best, we can estimate the distance at 665 feet.
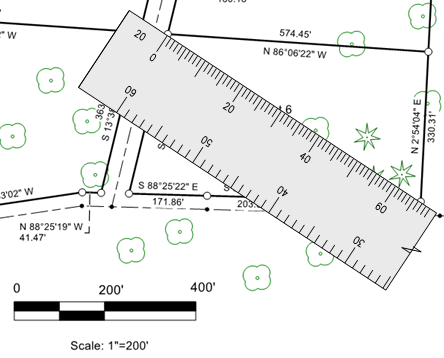 |
| Figure C-17 Measurement on a Paper Map |
Does enlarging the map increase accuracy or measurement ease? Consider Figure C-13. Data collection accuracy at 1:100,000 is higher than that required at 1:800,000. Not only are symbol sizes increased with enlargement making measurement more difficult, so are mapping errors. Enlarging a map does not make its data better.
Which brings us to digital maps.
Although digital maps are generally drawn full size and therefor scaleless, their features are still dependent on data density and collection accuracy. A digital map, just like its physical counterpart, is compiled at an accuracy to meet a need. Using the map for any purpose at or below the compilation accuracy is fine.
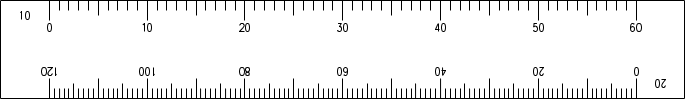
A digital map is easy to enlarge, much easier than a paper map. Unlike a paper map, feature symbols generally do not increase. Figure C-18 is Lot 6 on a digital map shown at two different scales. Symbols sizes and line weights are the same at both scales.
 |
| Figure C-18 Enlarged Digital Map |
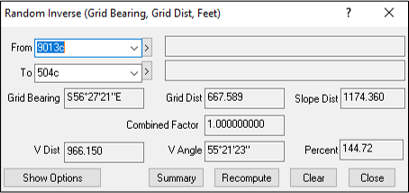
Measurement in a digital environment is not limited by a physical device. Measurement is one of many software functions. Results will be shown to the number of decimal places set in the software, not based on feature uncertainty. Figure C-19 is the software computed distance between the northwest and southeast corners of Lot 6 in Figure C-18.
 |
| Figure C-19 Digital Measurement |
The distance is given to 0.001 ft. Is it that accurate? What if the corner locations were good to only to ±0.5 ft? The software does not propagate feature uncertainty into computed measurements. A digital environment can result in a false sense of accuracy.
How can the user determine map resolution?
On most physical maps, accuracy is not generally specified. Is is implied from the map's:
- purpose
- compilation technique
- original scale
In Wisconsin, for example, legal maps are based on surveys having specific measurement accuracy standards.
Some paper maps did provide accuracy information. When still produced and distributed in paper form, USGS topoquads included the statement "This Map Complies With National Map Accuracy Standards." This was a formal horizontal and vertical accuracy standard for smaller scale maps.
What about digital maps? It depends on the type of map and how it is compiled. Many contemporary digital maps, particularly those created in Geographic Information Systems (GIS) include metadata. Metadata is information about the map including some indication of its data source, compilation, and accuracy. Traditional maps, such as Wisconsin legal maps, created in a digital environment must conform to the same standards as their physical equivalents.
Many digital maps, however, are bereft of accuracy information. The user has to determine applicability of digital information based on whatever information can be gleaned from its purpose or data source(s).
A scale-less environment can introduce as many problems as the advantages it brings.
6. Misc Digital Scale Effects
In manual drafting, scale was an upfront consideration to make the objects fit on a sheet of paper. In a digital environment, we create features full size and may not initially consider scale. However, depending on the software environment, a few things can affected by scale so it can't be ignored.
a. CAD software
(1) Physical Plot
Many digital maps are still plotted to paper for a variety of reasons. Features and support elements must be arranged so they all fit on the desired sheet size. CAD (Computer Aided Drafting) software is a generic precise drawing environment leaving map composition decisions to the user. A common frustration for neophyte CAD mappers is text size. For example, a 200 foot long boundary is to be labeled with 1/8" text size. Since everything in CAD is drawn full size, specifying a 1/8" text size results a 1 in = 100 ft plot like Figure C-20.
| Figure C-20 Text Size |
To plot correctly at 1 in = 100 ft, the text size must be adjusted accordingly: 1/8 in x (100 ft / 1 in) = 12.5 ft.
The CAD text size is set to 12.5 ft so it plots correctly, Figure C-21.
| Figure C-21 Text Scaled |
(2) Line Patterns
CAD line patterns are generally defined by one or more segment lengths separated with spaces, Figure C-22.
 |
| Figure C-22 Line Pattern |
Segment length(s) and spacing are controlled by line scaling. If the scaling is too small, the segments and spaces overlap and the patterned line looks like a continuous line, Figure C-23.
 |
| Figure C-23 Incorrect Scaling |
Line scaling can generally be set, either globally for all lines using the pattern, or for individual lines. Figure C-24 is the same pattern at two different line scales.
| Figure C-23 Same Pattern at Different Line Scales |
Line scale should be set based on map plot scale.
b. Mapping Software
Mapping software manages all the minutia allowing the map maker to concentrate on graphics creation. Once the user specifies a map scale and sheet size, the software adjusts map elements accordingly. The user specifies the plotted text size and the software will determine its correct drawing size. If a different plot scale or sheet size is used, the software automatically compensates; the user does not have to recompute text size, line scaling, symbols sizes, etc.