{KomentoDisable}
D. TSI Angle Error Sources and Behavior
Regardless of a TSI's angle resolution, accurate angle measurement results are only possible if instrument set up and pointing errors are minimized. Remember that in angle measurement three points are involved: a TSI location and two sighting locations. The two largest errors are instrument centering and pointing. And as with any other measurement type, the more measurements made the greater opportunity for random error cancellation leading to a more accurate result.
1. Instrumental
a. Maladjustment
TSI instrumental errors are described in Topic XV. Chapter G. Theodolite and Total Station. Instrumental errors are almost all systematic and most can be eliminated by appropriate measurement procedures.
Instrumental errors and compensation for support equipment are described in Topic XV. Chapter B. The Basic Stuff. While most of these also behave systematically, there can be some random effects such as loose tripod hardware.
b. Crosshair design
(1) Description
In early telescope-based surveying instruments, crosshairs consisted of spider web stands attached to a reticule ring. In addition to their delicacy, they offered the surveyor only a single sighting option: a solid line, Figure D-1(a). As instrumentation and optics evolved, crosshairs eventually became etched lines on optically flat glass plates. Etching allows for more creative and effective crosshair designs, Figures D-1(b) and D-1(c) being two examples.
|
(a) |
(b) |
(c) |
| Figure D-1 Crosshair Styles |
||
A narrow sight mark, such as a plumb bob line, at a longer distance may appear narrower than the vertical solid hair causing some pointing error - the hair obscures the string. Using a split hair design, such as Figure D-1(c), allows the operator to see both the sight mark and the hair. It is often easier to center the mark between hairs than try to make it coincide with a single one, Figures D-2(a) and (b).
|
(a) |
(b) |
| Figure D-2 Sighting Plumb Line |
|
(2) Behavior
Random.
(3) Compensation
Modern instruments use crosshair design(s) that help make target sighting easier. Target selection can still affect sighting error and is discussed under Personal error sources.
2. Natural
a. Climate
(1) Description
Weather can have various detrimental effects on angle measurement:
- Heat waves are atmospheric anomalies that can randomly bend the Line of Sight (LOS) displacing the sight or making target pointing difficult.
- Wind may cause the LOS to bounce or make a hand-held target difficult to hod steady.
- A large temperature difference between equipment storage and use requires acclimation time or tripod leg locks may loosen and slip or TSI locks/slow-motions jam.
- Cold uncomfortable temperatures can result in haphazard work.
(2) Behavior
Combined effect is random.
(3) Compensation
In as much as possible select times and locations minimizing climate impacts. Allow equipment temperature acclimation. Dress for conditions.
b. Curvature and Refraction
(1) Description
Curvature and refraction each displace the LOS vertically, though in opposite directions. They affect vertical/zenith angle measurement but not horizontal.
(2) Behavior
Curvature and refraction are treated as systematic errors.
(3) Compensation
Curvature and refraction are a function of distance and can be mathematically compensated manually or automatically by the instrument.
Curvature and refraction are described in Topic II Chapter E. Systematic Errors
3. Personal
a. Centering
(1) Description
The angle desired is the one defined by the ground points. To measure that angle requires an instrument, TSI or sighting mark, be set up at some height above each point. The center of the instrument should be exactly vertically above the ground point.
- The TSI is oriented using either an optical plummet or plumb bob and, while close.
- Sighting marks may consist of freely suspended plumb bobs, reflector poles with built in bubbles, or tripod/tribrach-mounted target each with its own centering challenge.
Figure D-3 shows the relationship of centering errors on an angle measurement.
 |
| Figure D-1 Centering Errors |
(2) Behavior
Centering errors, individually and cumulatively, behave randomly.
(3) Compensation
Although the error is never fully eliminated, TSI centering over a point gets better with practice. The same is true with a tripod mounted target.
Pole mounted targets generally have larger centering errors unless a pole bipod or tripod is used. Keeping a handheld pole as short as possible reduces the error from pole wavering. For stability, a second pole or lath can be used as a support, Figure D-4, on windy days.
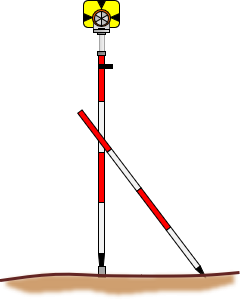 |
| Figure D-4 Stabilizing a Reflector Pole |
b. Pointing
(1) Description and Behaviors
Pointing error depends on how accurately the TSI operator can sight (point) at the BS and FS marks. A number of things affect this, the most significant being:
- Parallax
- Target width
- Target distance
Parallax
The effect and removal of parallax been discussed before. By now the operator should be familiar with its behavior and how to remove it. Even though its affect is random and it's instrument based, failure to remove it is a personal error.
Target width and distance
Although these are separate characteristics they are related because in combination they affect the sight mark's relative size. Figure D-5 shows the same reflector pole sighted at two different distances. The closer the pole is, the more difficult to center the cross hair on it.
|
(a) Distance = x |
(b) Distance = 2x |
| Figure D-5 Pointing Error |
|
At shorter distances, a narrower sight mark, such as a plumb line, should be used for more accurate pointing.
How much pointing error could we expect? As an extreme, consider sighting the edge of a target rather than its center, Figure D-6.
 |
| Figure D-6 Sight Distance and Angular Error |
Table D-1 shows the error for two different target types at varying distances. The targets are a 0.10 ft diameter reflector pole and a 0.03 ft diameter pencil.
| Table D-1 | ||||
| Reflector pole | Pencil | |||
| dia = 0.10 ft | dia = 0.03 ft | |||
| Dist (ft) | Accy: 1 in | Angle, a | Accy: 1 in | Angle, a |
| 100 | 2,000 | 0°01''43" | 6,670 | 0°00'31" |
| 200 | 4,000 | 0°00'52" | 13,300 | 0°00'15" |
| 300 | 6,000 | 0°00'34" | 20,000 | 0°00'10" |
| 500 | 10,000 | 0°00'21" | 33,300 | 0°00'06" |
| 1000 | 20,000 | 0°00'10" | 66,700 | 0°00'03" |
At shorter distances, the error could be quite substantial if the target edge was sighted instead of its center. At those short distances, it wouldn't be very likely that the edge would be sighted but centering the cross hair on a larger target does become less accurate.
The novice surveyor will notice that angle repetition is harder with larger D/R angle spreads in situations when either or both of the sights are short.
(2) Minimizing
Pointing error is a random error so we can't expect to eliminate it entirely, but it can be minimized with careful target selection and use. In addition to parallax removal, to minimize sighting error requires proper target selection, Figure D-7:
- At shorter distances, "finer" targets should be used.
- When using a rigid target that is in contact with the ground mark, such as a reflector or range pole, sight as low on the target as possible.
- A handheld plumb bob should be held as low and as near the point as possible to minimize swing and better center it.
- Sight the line closer to the support of a plumb bob suspended from a tripod where swing is least.
- For a tribrach mounted target, sight directly on the target.
 |
 |
 |
 |
| Figure D-7 Proper Sighting |
|||
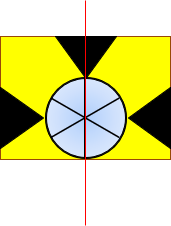
What about using the reflector glass center where the lines of the individual prisms intersect? That's fine when the reflector is perpendicular to the sight line, Figure D-8(a). However, when it's rotated, even slightly, Figure D-8(b), a horizontal offset is introduced because the assembly has depth and prism facets intersect is vertically offset.
 |
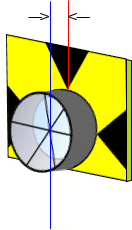 |
| (a) Front | (b) Rotated |
| Figure D-8 Sighting Reflector |
|
4. Random Error Propagation
a. Combined Random Errors
(Much of the material in this section has been adapted from Chapter 6 of Adjustment and Computations, first edition, by Wolf & Ghilani).
Many surveyors presume the angle display resolution is the angle measuring accuracy of the TSI. For example, if the TSI display can be set to show angles to 1" then the angle measuring accuracy must be 1". This is no different than a measuring a distance with a tape having a smallest division of 0.01 ft: because you can measure to 0.01 ft doesn't mean your measurement is accurate to 0.01 ft. Holding the 0 end of the tape over the mark will be subject to random error as will reading the tape. Propagating individual random errors will affect the error in the final measurement. Instrument resolution is but one of those errors.
Random errors affecting an angle measurement are can be divided into three categories, Figure D-9:
 |
| Figure D-9 Centering and Sighting Errors |
(1) TSI Pointing and Reading error, Epr
This is a characteristic of the instrument itself much like the MSA for electronic distance measurement.
The DIN 18723 standard was developed as a way to express the expected angle uncertainty of a digital instrument. The standard is more a statement of precision rather than accuracy. A later parallel standard, ISO 17123:3, was developed for the same purpose as DIN 18723 but using different calibration criteria. Many instrument manufacturers have adopted the ISO standard in place of the DIN. The instrument manual should show one or the other in the TSI specifications.
The relationship between the DIN 18723 or ISO 17123:3 precision, EDIN, and the expected combined pointing & reading error in a measured angle, Epr, is:
 |
Equation D-1 |
EDIN and Epr are both in seconds of arc.
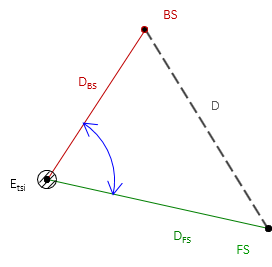
(2) TSI Centering error, Etsi
The error due to TSI centering is:
 |
|
||||
| Figure D-10 TSI Centering Error |
|||||
(3) Target Centering error, Et
 |
|
||||
| Figure D-11 Target Centering Errors |
|||||
(4) All Together...
The three errors are propagated as the Error of a Sum to determine the error in the measured angle:
 |
Equation D-4 |
(5) Examples
(a) Example 1
A TSI is used to measure an angle twice direct and reverse with a resulting average angle of 69°35'47". The BS mark is a tripod mounted target with a centering error of ±0.005 ft. The FS mark is a handheld prism pole. The bottom half of the pole is not visible because of the terrain so a centering error of ±0.02 ft will be used. The TSI has a 01" display and its centering error is ±0.003 ft. From the instrument manual, the TSI's stated ISO 17123:3 angle uncertainty is ±06". Approximate horizontal distances to site marks are shown in Figure D-12.
 |
| Figure D-12 Example 1 |
What is the expected error in the measured angle?
TSI Pointing and Reading error
TSI Centering error
To determine this error we need the distance between the targets. This can be computed from the Law of Cosines using the measured angle and distances to the target:

then
Target Centering error
Combined
The expected error in the angle is ±0°00'19"
Analysis
What's the largest source of error? Target centering, the prism pole in particular, is the largest error contributor.
If we replace the pole with a mark similar to that of the BS, the target centering error drops to ±07.23" and expected angular error to ±00°00'10."
(b) Example 2
The angle shown in Fig D-13 will be measured with a TSI having an ISO 17123:3 angle uncertainty of ±05" and centering error of ±0.003 ft. Both BS and FS marks are tripod mounted, also with a centering error of ±0.003 ft.
 |
| Figure D-13 Example 2 |
How many D/R sets must be turned to achieve an expected angular error no greater than ±09"?
The only error affected by the number of angles turned is TSI Pointing and Reading, Equation D-1. After substituting TSI Centering and Target Centering errors in Equation D-4, it should be solved for the TSI Pointing and Pointing error. Equation D-1 can then be solved for n.
Compute TSI Centering error, Etsi
Compute distance between targets
compute the error
Compute Target Centering error, Et

Set up Equation D-4 and solve for n
![]()
Square both sides, sort terms, and replace Epr with Equation D-1.

solve for n:

11.92 is the minimum value for n to achieve an expected accuracy of ±09"
n is the number of times the angle is measured, direct or reverse. Since we always measure direct and reverse sets, n must be an even integer. Since it's not possible to measure 11.92/2 = 5.96 D/R sets, n must be 12 (6 D/R) or 10 (5 D/R).
For n=10, the angular error, Eang, is ±09.1", juuuust outside the criterion.
For n=12 the angular error is ±08.998"=±09.0".
To meet the ±09" criteria, measure 6 D/R
To further explore random error propagation, check the Distance and Angle Random Error Propagation spreadsheet in the Software section.
b. Angle repetition
Measuring the same entity multiple times allows random errors to compensate. Although they can never be entirely eliminated their effect can be lessened through repeated measurements. Measuring an angle direct and reverse is done to compensate for systematic instrumental errors not random errors. The average of a D/R set constitutes a single measurement; it's that resulting angle which has random errors. So to reduce random errors, we repeat D/R sets.
When measuring an angle, once the TSI and targets are set up, their centering error effects do not change during the measurement set. The only thing affecting the final error in the measured angle is the number of times the angle is measured. As seen in the analysis at the end of the second example problem, increasing the repetition from 3 D/R to 4 D/R reduces the expected error from 09.1" to 08.8".
If we vary the number of D/R sets in Equation D-1 we can see how it affects the TSI Pointing and Reading error. The chart in Figure D-13 shows the effect on TSI pointing and reading error as the number of repetitions is increased. Initially, there is a large accuracy improvement up to about 6 D/R. Once past 20 or so sets, additional measurements yield smaller error improvements.
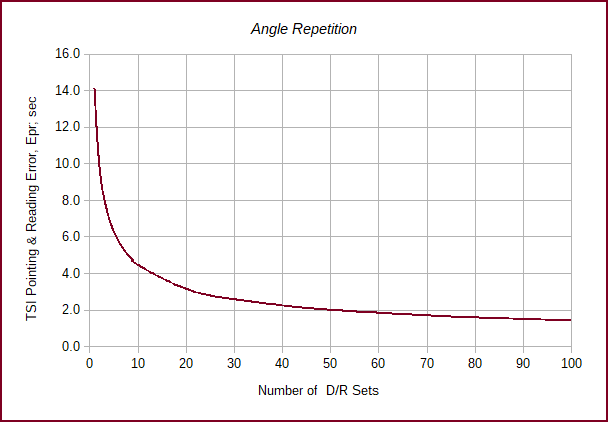 |
| Figure D-13 Angle Repetition Effect |
The chart in Figure D-14 compares three TSIs with different ISO angle uncertainties while varying D/R sets. At fewer D/R sets there is a larger error difference between the TSIs. As the number of D/R sets increase, the error differences become smaller.
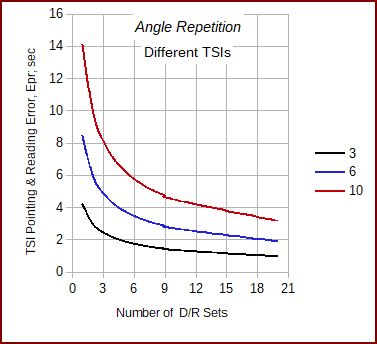 |
| Figure D-14 Different TSI Resolutions |
Figure D-14 can also be used to determine how many D/R sets are needed to meet a specific Epr. For example, to achieve a 4" accuracy:
- the 10" TSI would require 13-14 D/R sets
- the 6" TSI would require 4-5 sets
- the 3" TSI would require 1-2 sets
An example how this is applied is in the FGCC's Standards and Specifications for Geodetic Control Networks which contains a number of formal standards for angle measurement. In particular, the angle measurement standards for Precise Traverse include these two tables:
| Table D-2 Instrumentation Requirements | |||||
|---|---|---|---|---|---|
| Order | First | Second | Second | Third | Third |
| Class | I | II | I | II | |
|
Theodolite, least count |
0.2" |
1.0" |
1.0" |
1.0" |
1.0" |
| Table D-3 Field Procedures (partial) | |||||
|---|---|---|---|---|---|
| Order | First | Second | Second | Third | Third |
| Class | I | II | I | II | |
| Directions | |||||
|
Number of positions |
16 |
8 or 12† |
6 or 8* |
4 |
2 |
|
Standard deviation of mean not to exceed |
0.4" |
0.5" |
0.8" |
1.2" |
2.0" |
|
Rejection limit from the mean. |
4" |
5" |
5" |
5" |
5" |
|
† 8 if 0.2", 12 if 1.0" resolution. |
|||||
(A position is a single D/R set).
The least count in Table D-2 is actually the theodolite reading resolution. Although not the same as the DIN or ISO standard for digital equipment, least count was typically used for the same purposes until the 1980s (the last reprint of the Standards was in 1984).
Table D-3 contains similar information we divined from Figure D-14 except it includes a bit more detail. It formally identifies the number of D/R sets needed along with some variations based on equipment resolution. As a point of interest, note the night time observation requirement.
Keep in mind that this discussion and Figures D-13 and D-14 address only the TSI Pointing and Reading error. The total expected angle error would also include the TSI Centering and Target Centering errors which are independent of angle repetition.
c. Random Thoughts
So what does all this mean?
Because there are so many random error sources in measuring angles we have to be careful with measurement procedure. While equipment quality can make a difference in angular accuracy, it is only a single contributor. Equipment centering at all three points (BS, Occupied, FS). target types, and number of measurements all affect the quality of the final result. The discussion and examples in this chapter should provide the surveyor with a picture of how different errors can affect angular accuracy and what steps can be taken to minimize them.